What a Website Status Checker Checks When You Enter a URL
Why Can't I Just Reload My Browser to Know if a Site Is Down? You hit refresh. The page still won't load. You try again. Nothing. But here's the problem: that spinning wheel tells
Why Can't I Just Reload My Browser to Know if a Site Is Down?
You hit refresh. The page still won't load. You try again. Nothing. But here's the problem: that spinning wheel tells you absolutely nothing about whether the website is actually down.
When your browser fails to load a site, the culprit could be sitting right in your own home. Your router might have hit its connection limit. Your ISP's DNS servers could be having a bad day. The corporate firewall might have just added that site to its blacklist. Your browser cache might be serving up yesterday's corrupted files. Even your antivirus software could be incorrectly flagging the site as suspicious.
These local failures create a frustrating reality: you can't trust your own connection to tell you if a website is down. It's like asking if the phone lines are working by using your own broken phone. You need an outside perspective.
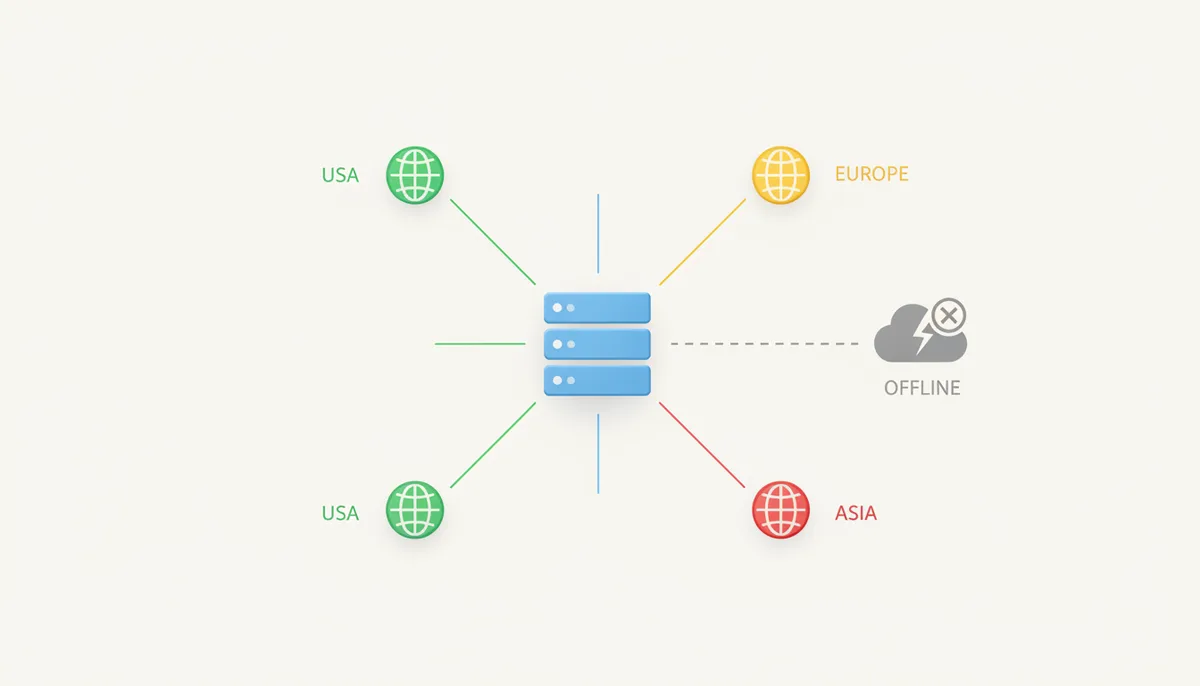
That's where distributed checking comes in. A proper website status checker doesn't rely on a single connection from one location. It sends requests from servers scattered across different continents, different network providers, different data centers. When a checker in Tokyo, Frankfurt, and San Francisco all agree that a site is unreachable, you know it's not just your Wi‑Fi acting up.
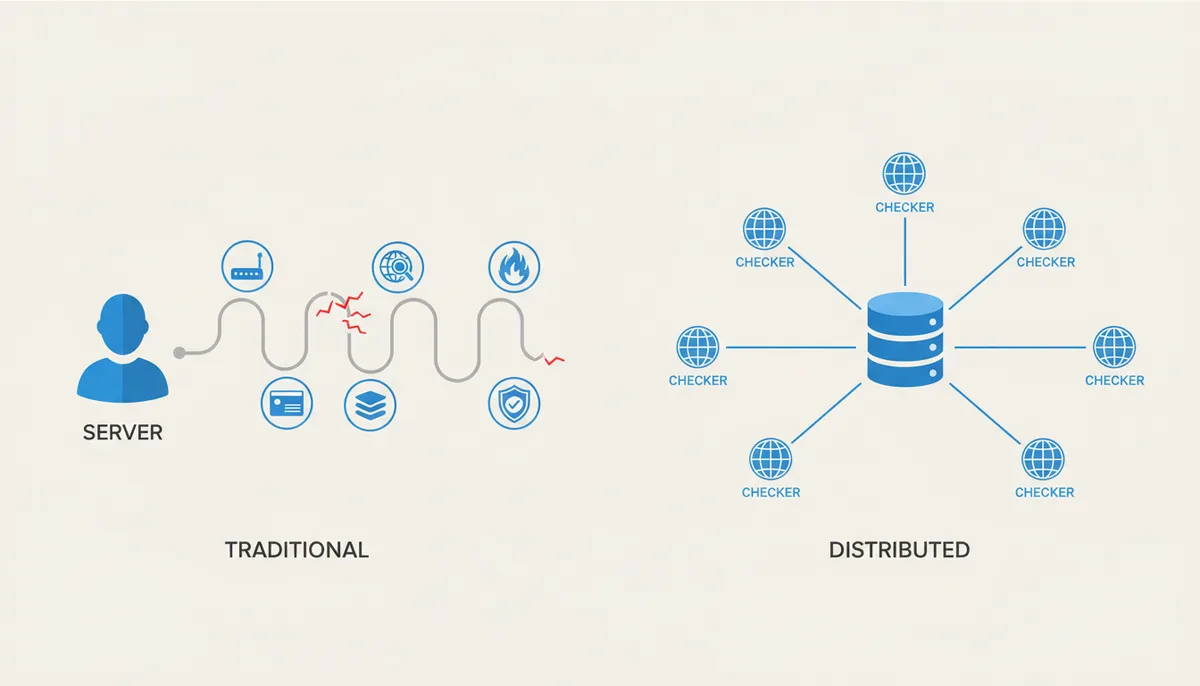
This geographic distribution also catches regional outages that you'd miss from a single vantage point. Amazon Web Services might be down in US‑East‑1 but humming along in Europe. An undersea cable cut might isolate Asian traffic while leaving American visitors unaffected. Only by checking from multiple locations can you distinguish between "down for me" and "down for everyone."
Step 1: Does the Website's Address Even Exist? (DNS Resolution)
Before a status checker can test if a website is working, it needs to find where that website lives. Every website has a human-friendly address like example.com, but computers communicate using numerical IP addresses like 93.184.216.34. Domain Name System acts as the internet's address book, translating one into the other.
The checker starts by querying DNS servers for two types of records. A records provide IPv4 addresses (like 93.184.216.34), while AAAA records provide IPv6 addresses (like 2606:2800:220:1:248:1893:25c8:1946). Many modern websites have both, and the checker needs to test all available addresses.
When DNS lookup fails, the response tells you exactly what went wrong. An NXDOMAIN response means "Non‑Existent Domain" – either the domain was never registered, it expired, or you typed it wrong. This is a definitive "down" state. No ambiguity here. The website doesn't exist on the internet.
But DNS gets trickier. When domain owners update their DNS records, those changes ripple across the internet's DNS servers at different speeds. This propagation can take anywhere from minutes to 48 hours. During this window, a status checker might get different answers from different DNS servers. The site appears down in Dallas but up in Dublin. This isn't a server problem – it's the internet's address book being updated one page at a time.
DNS failures also happen when nameservers themselves go offline. If example.com points to ns1.hostingprovider.com for its DNS records, and that nameserver stops responding, every domain it manages becomes unreachable. The websites might be running perfectly, but without DNS, nobody can find them.
Step 2: Can We Establish a Connection to the Server? (TCP Handshake)
Having an IP address doesn't mean anyone's home. The next test determines if a server at that address is actually listening for connections. This happens through a process called the TCP three‑way handshake.
Think of it as knocking on a door. The checker sends a SYN packet (the knock). If the server is running and accepting connections, it responds with a SYN‑ACK packet (acknowledgment of the knock plus its own greeting). The checker completes the handshake with an ACK packet (confirming the connection is established). This entire exchange typically takes milliseconds.
When this handshake fails, you learn something specific about the failure. A timeout – where the server never responds to the initial SYN – usually means the server is offline, overloaded, or a firewall is silently dropping the packets. A connection refused error, where the server immediately responds with a RST (reset) packet, means the server is online but no web service is running on that port.
Port numbers matter here. Web servers typically listen on port 80 for HTTP and port 443 for HTTPS. A server might be accepting connections on one but not the other. This is why some sites work with http:// but fail with https://, or vice versa.
Many people confuse this TCP check with a simple ICMP ping. They're fundamentally different. A ping only confirms that a server exists and its network stack is functioning. A server can respond to pings all day while its web server software remains crashed. TCP handshake testing specifically verifies that the web service is ready to handle requests.
Step 3: Is the Connection Secure? (SSL/TLS Certificate Validation)
For HTTPS sites – which is nearly every modern website – establishing a TCP connection is only half the battle. The checker must now verify that the site's security certificate passes multiple validity tests. A failed certificate makes a site effectively unusable for most visitors.
The certificate validation happens immediately after the TCP handshake. The server presents its SSL/TLS certificate, and the checker examines three critical aspects. First, has the certificate expired? Certificates have definite lifespans, typically 90 days to one year. When they expire, browsers show scary warning pages that most users won't bypass.
Second, does the certificate match the domain name? A certificate issued for secure.example.com won't work for www.example.com. This mismatch triggers the same browser warnings as an expired certificate. It's surprisingly common when companies use content delivery networks or load balancers with misconfigured certificates.
Third, is the certificate signed by a trusted Certificate Authority (CA)? Browsers maintain lists of trusted CAs like Let's Encrypt, DigiCert, and others. Self‑signed certificates or those from untrusted CAs trigger warnings. While technically the server is "up," these certificate problems create a complete barrier for users.
The checker also verifies the entire certificate chain. Most certificates aren't directly signed by root CAs but by intermediate certificates. If any link in this chain is broken – missing intermediate certificate, revoked certificate, or weak cryptographic signature – the whole verification fails.
When certificate validation fails, the status checker faces a judgment call. The server is responding. The website code is probably fine. But users can't safely reach it. Most checkers report this as "down" because that matches the user experience.
Step 4: What Does the Server Say? (The HTTP Request & Response)
Now comes the moment of truth. The checker crafts an HTTP request that mimics what a real browser would send. This isn't just asking "are you there?" – it's requesting an actual page and evaluating the response.
The HTTP request includes several components. The request line specifies the method (GET), the path (often just /), and the protocol version (HTTP/1.1 or HTTP/2). Request headers provide additional context. The Host header tells the server which website to serve (crucial for servers hosting multiple sites). The User‑Agent header identifies the client – checkers often use identifiers like "StatusChecker/1.0" rather than pretending to be Chrome or Firefox.
Some checkers include additional headers to better simulate real browser behavior. Accept headers specify what content types the checker can handle. Accept‑Encoding indicates support for compressed responses. Connection headers might request keep‑alive connections for faster subsequent checks.
The server's response comes in two parts: headers and body. Response headers convey metadata about the response – its status, content type, length, caching rules, and more. The response body contains the actual content: HTML for web pages, JSON for APIs, or binary data for images.
For basic status checking, the most critical piece is the HTTP status code in the first line of the response headers. This three‑digit code immediately tells the checker whether the request succeeded, failed, or requires further action. But the story doesn't end there – the checker must interpret what that code means for website availability.
How the Checker Interprets the Server's Answer (HTTP Status Codes)
HTTP status codes follow a standardized system where the first digit immediately reveals the response category. Understanding these categories helps predict how a status checker will interpret the result.
2xx codes signal success. A 200 OK means the request completed normally – the page exists and was served correctly. This is the green light every checker wants to see. Other 2xx codes like 201 Created or 204 No Content also indicate success, though they're less common for standard web pages.
3xx codes indicate redirection. A 301 Moved Permanently or 302 Found tells the checker to look elsewhere for the content. While technically not a direct success, these responses prove the server is functioning and actively directing traffic. Most checkers follow these redirects and base their final verdict on where they ultimately land.
4xx codes blame the client for the problem. A 404 Not Found means the server is working perfectly but can't find the specific page requested. A 403 Forbidden indicates the server understood the request but refuses to fulfill it. For uptime monitoring, these codes present an interesting dilemma: the server is clearly operational, but the content isn't accessible.
5xx codes point to server‑side failures – the smoking guns of downtime. A 500 Internal Server Error indicates the server encountered an unexpected condition. A 503 Service Unavailable explicitly states the server cannot handle requests right now. A 502 Bad Gateway reveals problems with upstream servers. These codes universally translate to "website down" in status reports.
| Code/Range | Name | Meaning for Uptime |
|---|---|---|
| 200 | OK | UP |
| 301 | Moved Permanently | UP (follow redirect) |
| 302 | Found | UP (follow redirect) |
| 403 | Forbidden | Server UP, access denied |
| 404 | Not Found | Server UP, page missing |
| 500 | Internal Server Error | DOWN |
| 502 | Bad Gateway | DOWN |
| 503 | Service Unavailable | DOWN |
The interpretation gets nuanced with edge cases. A 404 on the homepage (/) suggests a severe misconfiguration and might be reported as "down." A 403 might be expected behavior for a checker that isn't logged in. A 503 might include a Retry‑After header suggesting temporary maintenance. Smart checkers consider context beyond just the number.
Beyond the Status Code: Is the Right Content Being Served?
A 200 OK status can lie. Servers experiencing database connection failures, runtime errors, or misconfigurations often return "success" while serving error pages. These soft outages fool basic monitoring but frustrate real users just as much as hard downtime.
Content validation catches these false positives. The checker examines the actual HTML, looking for phrases that indicate problems. Common error messages like "Error establishing database connection" or "Unable to connect to API" reveal failures the status code missed. A page titled "Under Maintenance" tells a different story than the 200 status suggests.
Advanced checkers go further with positive validation. Instead of just looking for error messages, they confirm expected content appears. An e‑commerce homepage should contain product listings. A login page needs a username field. A blog should show recent posts. When these elements disappear, something's broken even if the server claims otherwise.
Size checks provide another validation layer. A typical homepage might weigh 100KB. If the server suddenly returns a 1KB response with 200 OK, that's suspicious. Empty responses, despite claiming success, indicate application failures. Some checkers establish baseline sizes during setup and alert on significant deviations.
Response timing also factors in. A server might return 200 OK but take 30 seconds to generate the page. While technically "up," this crosses into unusable territory. Most checkers implement timeout thresholds – if a page takes longer than 30 seconds, it's effectively down regardless of the eventual status code.
From Dozen Signals to a Single Verdict: How a Checker Decides 'Up' or 'Down'
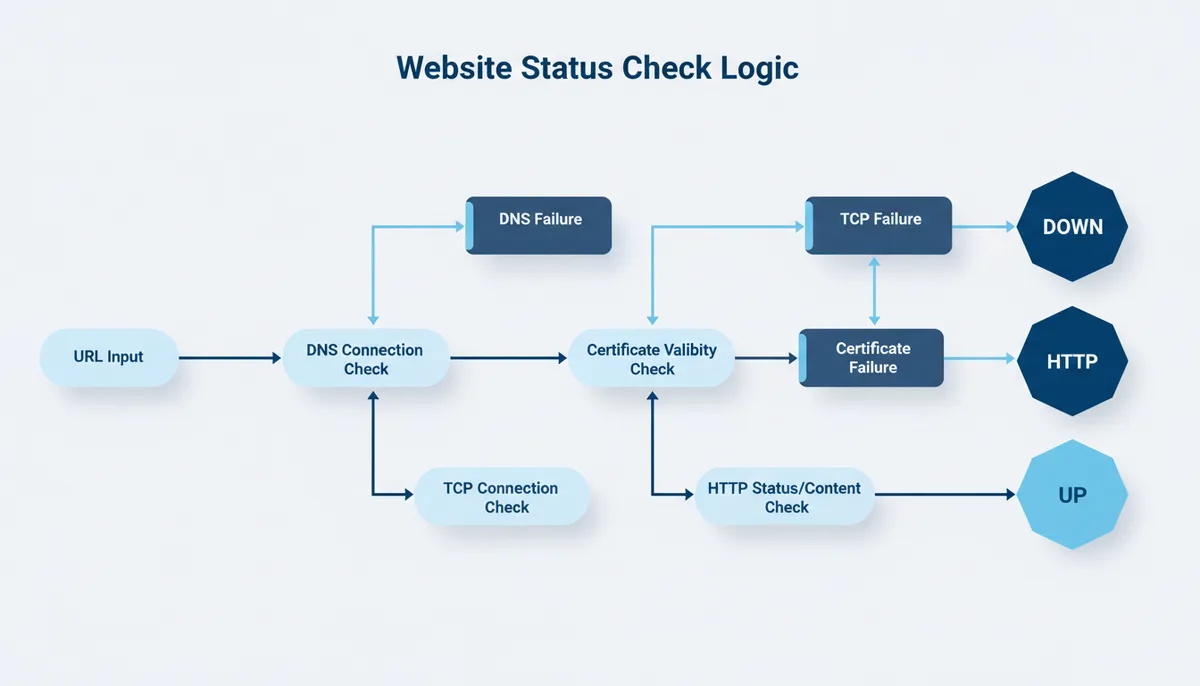
Each test generates a signal, but users need a simple answer: is the website up or down? The checker must synthesize DNS results, TCP connections, certificate validity, HTTP status codes, content checks, and response times into a single verdict.
The decision follows a hierarchy. DNS failure stops everything – without an address, there's nothing to check. NXDOMAIN or unresponsive nameservers mean immediate "down" status. No exceptions, no further testing needed.
TCP connection failure also triggers "down" status. If the checker can't establish a basic connection after reasonable retries and timeouts, the website is unreachable. The server might be overloaded, crashed, or offline – the reason matters less than the result.
Certificate failures complicate the verdict. An expired certificate technically means the server is responding, but browsers will block access. Most checkers report this as "down" to match user experience. Some offer a nuanced "Security Error" status to distinguish from complete outages.
HTTP status codes drive the next decision branch. All 5xx errors mean "down." Most 2xx codes mean "up," unless content validation finds problems. 3xx redirects get followed until reaching a final destination. 4xx codes require context – a 404 on the homepage means "down," while a 404 on a deep link might just mean "page not found."
Geographic consensus adds the final layer. When São Paulo reports "down" but Singapore says "up," you have a regional issue rather than global outage. Quality checkers test from at least three locations and require majority agreement before declaring a site down. This prevents local network hiccups from triggering false alarms.
Some checkers offer middle‑ground statuses like "Degraded" or "Partial Outage" when results conflict. A site returning 503 from one region but 200 from others isn't fully down but isn't healthy either. These nuanced statuses help operations teams prioritize their response.
More Than Just Up/Down: Measuring Website Performance
A website can be "up" and still be failing its users. Pages that take 20 seconds to load might as well be down. That's why modern status checkers measure performance alongside availability.
The performance clock starts with DNS lookup time. Resolving a domain typically takes 20–100 milliseconds. When it stretches beyond 200ms, you're looking at DNS configuration problems, overloaded nameservers, or network routing issues. High DNS times affect every single page load, making them particularly painful for user experience.
TCP connection time reveals network health between the checker and server. Normal connections establish in 10–50ms for nearby servers, 100–200ms for cross‑continental connections. Spikes indicate network congestion, firewall processing delays, or server resource constraints. Consistently high connection times often precede complete outages.
TLS handshake duration specifically measures the overhead of secure connections. After TCP connects, establishing encryption typically adds 20–100ms. Excessive TLS times point to server CPU constraints (encryption is computationally expensive) or certificate chain problems requiring additional validation.
Time to First Byte (TTFB) captures how long the server takes to start sending the response after receiving the request. This metric isolates server processing time from network transit. A slow TTFB indicates backend problems: database queries taking too long, application code inefficiencies, or server overload. While network fixes are often outside your control, TTFB improvements are usually within reach.
| Metric | What It Measures | What a High Value Suggests |
|---|---|---|
| DNS Lookup | Time to resolve domain to IP | DNS configuration issues, nameserver problems |
| TCP Connect | Time to establish connection | Network congestion, firewall delays, server overload |
| TLS Handshake | Time to establish encryption | Server CPU constraints, certificate chain issues |
| Time to First Byte | Server processing time | Slow database queries, inefficient code, backend problems |
| Content Download | Time to receive full response | Large page size, slow server disk I/O, bandwidth limits |
Total response time combines all these components plus content download time. While each component tells part of the story, patterns across metrics reveal the full picture. High TTFB with normal network times points to application problems. High connection times with fast TTFB suggests network issues. Everything slow indicates either severe server overload or the checker hitting rate limits.
Performance trending matters as much as absolute numbers. A homepage that usually loads in 500ms but suddenly takes 3 seconds hasn't crossed into "down" territory, but something changed. These performance degradations often telegraph upcoming outages, giving operations teams a chance to intervene before users notice.
What Happens When Major Sites Use Custom Error Pages
Netflix shows a friendly error page when their recommendation engine fails. GitHub displays an angry unicorn during outages. Google serves a minimalist "502 That's an error" message. These custom error pages break traditional status checking in ways that frustrate both monitoring tools and the teams relying on them.
The problem starts with load balancers and edge servers. When GitHub's application servers crash, their load balancer doesn't return a 503 Service Unavailable. Instead, it serves a cached HTML page with a 200 OK status. The page looks polished – it has GitHub's logo, proper styling, even interactive elements. But it's still an error page. Basic status checkers see that 200 OK and report "all systems operational" while developers can't push code.
Content Delivery Networks (CDNs) make this worse. Cloudflare's "Always Online" feature serves cached versions of your site when the origin server fails. Visitors see outdated content instead of error messages. From one perspective, this improves user experience. From a monitoring perspective, it masks critical failures. Your database might be melting down while Cloudflare cheerfully serves last week's homepage to status checkers.
Large platforms often implement sophisticated failover systems that confuse monitoring. Amazon routes traffic away from failing regions automatically. Your status checker hits US‑East‑1, gets redirected to US‑West‑2, receives a successful response, and reports everything's fine. Meanwhile, half your infrastructure is offline and your auto‑scaling bills are tripling from the unexpected load shift.
API endpoints create unique challenges. A REST API might return 200 OK with an error object in the JSON response body: {"status": "error", "message": "Database connection failed"}. The HTTP layer worked perfectly. The application layer failed completely. Status checkers focused on HTTP codes miss these application‑level failures entirely.
Smart status checking requires understanding these patterns. For sites using custom error pages, you need content validation that looks for specific success indicators, not just the absence of errors. Check for elements that only appear when the application works: recent timestamps, dynamic content, user‑specific data. A news site should have articles from today. An e‑commerce site should show products with prices. A forum should display recent posts.
Some checkers implement screenshot comparison or visual regression testing. They capture how the page should look when healthy, then compare each check against this baseline. When GitHub shows an angry unicorn instead of repository listings, visual comparison catches it immediately regardless of status codes.
The most sophisticated approach combines multiple validation strategies. Check the HTTP status, verify expected content exists, confirm dynamic elements loaded, and measure whether JavaScript executed successfully. When monitoring major platforms, assume they're doing something clever with error handling and plan your checks accordingly.
Frequently Asked Questions
If a site is 'UP' but I still can't access it, what should I do?
Start with your browser. Clear its cache and cookies, then try accessing the site again. Browser cache corruption causes more access problems than most people realize. If that doesn't work, flush your computer's DNS cache. On Windows, run "ipconfig /flushdns" in Command Prompt. On Mac, the command varies by version but typically involves "dscacheutil -flushcache".
Still stuck? The issue likely sits between you and the website. Your ISP might be experiencing routing problems or actively blocking the site. Corporate firewalls love to block social media and streaming sites. Some countries implement national firewalls that checkers' international servers bypass. Try accessing the site through your mobile phone's data connection – if it works there but not on your home network, you've identified the culprit.
Why do different status checkers sometimes give different results?
Geography plays the biggest role. A checker with servers only in North America might miss Asian regional outages. Another checker testing from 50 locations worldwide gets a more complete picture. The physical distance between checker and target website affects everything from response times to routing paths.
Checkers also define "down" differently. Some report down only for 5xx errors. Others include certificate failures. Some follow redirects indefinitely while others stop after a few hops. Timeout thresholds vary wildly – one checker might wait 60 seconds while another gives up after 10.
Testing depth creates more variations. Basic checkers stop at HTTP status codes. Advanced ones validate content, check specific page elements, or verify response sizes. A basic checker sees 200 OK and reports "up." An advanced checker notices the page says "database connection error" and reports "down." Both are correct within their own definitions.
Does a website status check affect the website's performance?
A single status check has the same impact as one person visiting your homepage – essentially nothing. Modern web servers handle thousands of requests per second. One extra request every few minutes disappears in the noise.
Continuous monitoring at reasonable intervals (every 1–5 minutes) adds predictable load equivalent to a handful of regular visitors. The requests come from known IP addresses at consistent intervals. This predictability actually makes them easier for servers to handle than random traffic spikes.
Only extremely aggressive monitoring causes problems. Checking every second from dozens of locations might add noticeable load to small servers. But at that frequency, you're essentially running a stress test, not monitoring. Professional monitoring services understand this balance and default to sustainable check intervals.
Can a status checker see if my login page or shopping cart is broken?
Basic status checkers can't test functionality requiring multiple steps or authentication. They make simple requests to public URLs and evaluate responses. A login process requires sending credentials, handling cookies, following redirects, and maintaining session state – beyond basic checking capabilities.
Testing complex user journeys requires synthetic or transaction monitoring. These advanced tools script entire workflows: visit homepage, click login, enter credentials, verify dashboard loads. They can test shopping carts by adding items, proceeding to checkout, and verifying each step completes correctly.
API monitoring fills a middle ground. While not testing full UI workflows, it can verify that your authentication endpoints accept credentials and return proper tokens. This catches many backend failures that break logins without requiring full browser automation.
What's the real difference between a 'ping' and a website status check?
Ping uses ICMP (Internet Control Message Protocol) to test basic network connectivity. It asks "does this IP address exist and respond to network traffic?" The server's network stack handles ping responses automatically, regardless of what applications are running. A server with a completely crashed web server will still respond to pings.
Website status checking tests the entire application stack. It verifies DNS resolution, establishes TCP connections on specific ports, validates SSL certificates, sends HTTP requests, and evaluates responses. Each layer could fail independently while others work fine.
Think of ping as checking if someone's home by seeing if their lights are on. Status checking knocks on the door, asks to come in, verifies they're serving dinner, and checks that the food isn't burned. One tells you the house exists; the other confirms everything's functioning as expected.
How can a website be 'up' for HTTP but 'down' for HTTPS?
HTTP and HTTPS run as separate services on different ports. HTTP typically uses port 80 while HTTPS uses port 443. These can fail independently based on server configuration, certificate problems, or firewall rules.
Certificate issues create the most common split. An expired SSL certificate breaks HTTPS while leaving HTTP untouched. Misconfigured certificate chains, wrong domain names in certificates, or corrupted certificate files all create HTTPS‑specific failures. The web server software runs fine, but the secure version remains inaccessible.
Server configuration errors also cause splits. Apache or Nginx might have correct configuration for the HTTP virtual host but syntax errors in the HTTPS version. Resource constraints sometimes force administrators to disable HTTPS during overload conditions while keeping HTTP alive. Firewall rules might block port 443 while allowing port 80. Each creates a situation where one protocol works while the other fails.
Conclusion
Understanding what happens during a website status check transforms a simple "up" or "down" result into actionable intelligence. Each step in the process – from DNS resolution through content validation – tells you not just whether a site is accessible, but why it might be failing and where to look for fixes.
The next time you see a status checker report, you'll recognize the journey that verdict represents. Multiple servers across continents worked together, navigating DNS lookups, establishing secure connections, interpreting HTTP responses, and validating content. That simple green checkmark or red X summarizes dozens of technical validations into an answer anyone can understand.
For website operators, this knowledge helps you prepare for what checkers test and optimize accordingly. For users, it explains why your browser's view might differ from the checker's results. Either way, you now know what really happens when someone asks that fundamental question: is this website actually working?
Sources
- IETF (Internet Engineering Task Force) — The technical specifications and mechanics of core internet protocols discussed, including DNS (RFC 1034/1035), TCP (RFC 793), and HTTP (RFC 9110-9114).
- Mozilla Developer Network (MDN) Web Docs — Authoritative definitions and explanations for HTTP status codes, which are central to how a checker interprets a server's response.
- Cloudflare Learning Center — Detailed yet accessible explanations of fundamental concepts like 'What is DNS?', 'What is a TCP handshake?', and 'What is an SSL certificate?'
- ICANN (Internet Corporation for Assigned Names and Numbers) — Information on the role and governance of the Domain Name System (DNS), backing the explanation of how a checker first resolves a website's address.
- Let's Encrypt — The explanation of how SSL/TLS certificates are issued and validated by a Certificate Authority (CA), a key step in the HTTPS check.
- web.dev by Google — The definition and importance of performance metrics like Time to First Byte (TTFB), used in the section on performance measurement.