What Response Time Actually Means on a Website Status Check
Your status checker says the site is up. Green light, HTTP 200 status code , everything fine. Meanwhile, two customers have emailed to say your checkout page takes 12 seconds to lo

Your status checker says the site is up. Green light, HTTP 200 status code, everything fine. Meanwhile, two customers have emailed to say your checkout page takes 12 seconds to load, and one of them already bought from a competitor. Technically, your site is reachable. Practically, it's down.
That gap between "server responds" and "site is usable" is exactly where the response time number on a status checker earns its place. A simple up/down check tells you the server's alive. Response time tells you how alive. This guide breaks down what that number actually measures, from the DNS lookup to the first byte back, what counts as good, why it goes bad, and how to fix it.
Why a 'Slow' Website Is a 'Down' Website to Your Users
When a checker requests your homepage and gets an HTTP 200 status code, it records "UP" — the server accepted the request and returned a valid page. Compare that with a 503 (service unavailable) or a timeout, which get flagged as down. The problem is that a 200 arrives just as happily on an 8-second page load as it does on a 300-millisecond one. Reachability without speed is a hollow win.
Users don't wait patiently for the distinction. Once a page takes more than a few seconds to show anything, abandonment climbs sharply and keeps climbing with every extra second. The exact curve doesn't matter as much as the shape of it: every unnecessary second shaves off a slice of your visitors. On an e-commerce checkout or a signup form, those abandoned sessions are revenue you already paid to acquire — the ad click, the affiliate referral, the campaign email — gone because the server was slow, not because the offer was wrong.
There's also a quieter cost. People who hit a slow site start to distrust it. They hesitate to enter card details on a page that visibly struggles. Support tickets come in that say "site's broken" when your monitoring swears it's healthy. If you judge site health purely by binary uptime, you'll be the last to know.
Response time — measured in milliseconds on most checkers — is the metric that bridges technical uptime and what a human being in a browser actually experiences. Watch it, and you catch the degradation that an up/down check sails straight past.
The Anatomy of a Request: What 'Response Time' Actually Measures
In the context of a status checker, "response time" is best understood as a Time to First Byte (TTFB)-like measurement: the elapsed time from when the request goes out to when the server's response starts coming back. Not the whole page. Not the images and scripts. Just the server's first word in a conversation. That makes this number foundational — everything else in the page load is stacked on top of it.
The complication is that different tools draw the boundaries of that measurement differently. One checker stops the clock when the first byte of the response body arrives, another when the response headers land, and a third only once the full response has downloaded. Some start the clock before the DNS lookup and connection setup; others start it the moment the connection already exists. So unless a tool documents its exact definition, treat its response time as comparable only within that same tool — trend it over time, never across tools.
Here's what happens between "request sent" and "first byte received," with illustrative timings for a typical visit to an uncached connection:
- DNS lookup. The browser or checker translates your domain into an IP address. Often cached close to instant; worst case, a slow provider can burn 80–100 ms here. Say 30 ms for our example.
- TCP handshake. The client and server agree to open a connection — a SYN, SYN-ACK, ACK exchange that costs one network round trip. Roughly 45 ms if the server is on the same continent.
- SSL/TLS negotiation. For HTTPS (essentially everything now), client and server swap certificates and agree on encryption keys. One or two more round trips: another 90 ms.
- HTTP request sent and server processing. The request travels in, and now the server does its real work: runs application code, queries the database, assembles the HTML. This is usually the biggest slice — say 250 ms.
- First byte returned. The moment the server's first chunk of response heads back, TTFB stops. In our example: about 415 ms total.
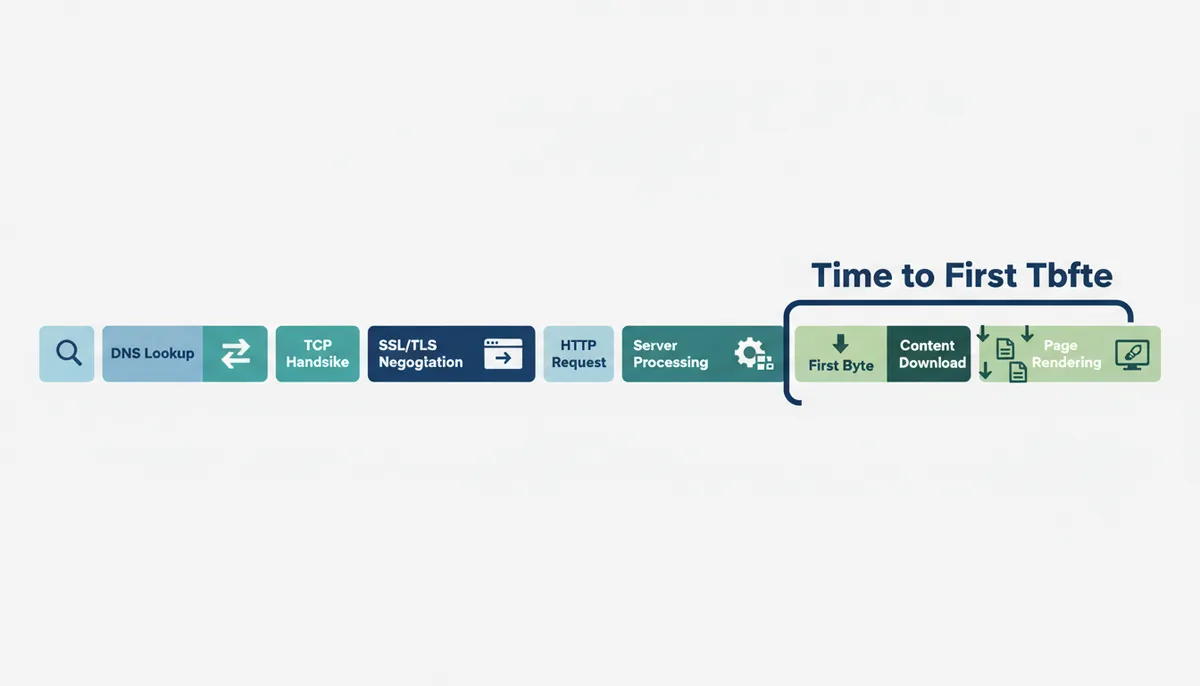
Full page load time starts where TTFB stops. After that first byte, the browser downloads the rest of the HTML, discovers and fetches CSS, JavaScript, fonts and images, executes scripts, and paints pixels. Your total might be 2.8 seconds even when TTFB is a respectable 415 ms, because rendering and asset delivery dominate the rest.
That distinction produces the vocabulary you'll see in performance tools: First Contentful Paint (FCP) for the first visible pixels, Largest Contentful Paint (LCP) for the main content finishing, and Interaction to Next Paint (INP) — the current Core Web Vitals responsiveness measure — for how quickly the page reacts to inputs. All of it ends up downstream of TTFB. Latency drives the first byte; bandwidth and throughput govern how fast the megabytes of assets follow. Confuse the two and you'll "optimize" the wrong thing.
Decoding the Numbers: What Is a Good Server Response Time?
Response time values are judgment calls, but the industry has rough boundaries that won't steer you wrong. Treat them as a rule of thumb, not a law:
| Response Time (ms) | Rating | Impact on User Experience | Example |
|---|---|---|---|
| Under 200 ms | Excellent | Page starts rendering almost immediately; the site feels instant | Static file or fully cached page served from a CDN edge node |
| 200–500 ms | Good | Acceptable for most pages; only a slight pause on dynamic content | An optimized dynamic page, like a logged-in dashboard or cart |
| 500 ms – 1 s | Needs improvement | A visible delay before anything appears; mobile users on weak networks feel it hardest | Uncached CMS page stacked with plugins and no page caching |
| Over 1 s | Poor | Users regularly bounce before render; checkout and signup flows bleed conversions | Shared hosting under load, or a site missing database indexes |
"Good" is contextual. A static HTML file served from a CDN should live under 200 ms comfortably — there's no real server work involved. A dynamic, database-backed page can't always be cached away, so expecting under 200 ms for every request sets you up to fail. For those, 200–500 ms is a healthy ambition. The second context: geography. A visitor in the same city as your server enjoys numbers your overseas customers won't. Compare like with like, and grade against your own baseline over absolute thresholds.
There's one absolute worth aiming for: Google grades page experience through Core Web Vitals, and its flagship metric is LCP, with 2.5 seconds as the line between "good" and everything worse. LCP can't complete until TTFB finishes — TTFB is the first link of the chain that produces the biggest content paint. Burn 2 seconds waiting for the first byte and the LCP grade is mathematically unrecoverable, no matter how clean the rest of your page is. A slow response time doesn't just feel bad; it's a ceiling on how well your page can ever score.
Deciding rule: if the page can be cached, shoot for under 200 ms. If it must be rendered fresh per request, aim for under 500 ms. Over a second, something server-side is genuinely wrong.
The Usual Suspects: Common Causes of High Response Time
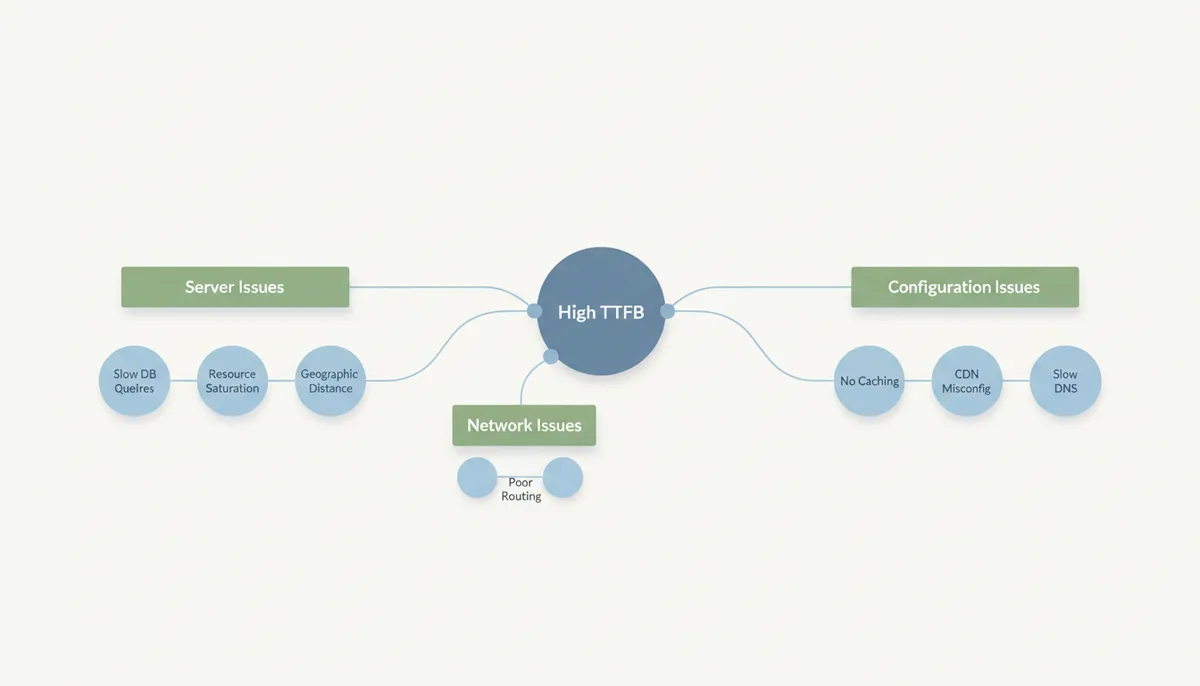
When TTFB balloons, the cause falls into one of three buckets: the server itself, the network between you and it, or the configuration wiring it all together. Troubleshoot in that order, because server-side problems are the most common and the most fixable.
Server-side issues. The server got the request on time, then stalled while composing a response. The classic culprits:
- Inefficient application code. A page template that makes 60 database calls where 3 would do, or that waits synchronously on a third-party API while generating the response. PHP, Python, Ruby — the language matters less than the pattern.
- Bad database queries. A query that can't use an index might scan two million rows, taking 900 ms where an indexed lookup returns in 8 ms. "N+1" patterns, where the code loops and queries instead of joining, are the usual offender.
- Starved resources. CPU pinned at 100% during traffic spikes, or memory pressure forcing swap. On shared hosting, your neighbors' traffic can throttle your slice of the machine — a big reason response times swing wildly hour by hour.
Network latency. Physics charges a toll. Light travels fast, but a visitor in Sydney hitting an origin server in Virginia still pays on the order of 100 ms per round trip — and remember, HTTPS setup needs several round trips before the first request even lands. Bad routing and cheap peering multiply the damage. If your audience is far from your server, high TTFB isn't a bug; it's geometry.
Configuration. The fixable-by-settings bucket: page caching turned off so every single visitor forces a full re-render; a CDN that's either absent or misconfigured; cache headers that tell proxies to pass every request back to origin; slow DNS from a bargain registrar; keep-alive disabled so every asset re-acquires a connection. None of this needs new code — it needs someone flipping the right switches.
A worked example makes this concrete: a WooCommerce shop renders a product page in 1.6 seconds. The slow query log shows one query at 900 ms caused by a missing index on `meta_id`; the shop also re-renders on every request because page caching was never enabled. Add the index, flip on caching, put a CDN in front — and the same page comes back in 280 ms. Three fixes, three different buckets, one afternoon.
How to Measure and Monitor Response Time Accurately
Different measurement methods exist because they answer different questions. Mixing them up leads to bad decisions — like rewriting your frontend when the server was the problem, or vice versa.
Simple status checks send a request and record the status code plus response time in seconds. This is the triage instrument: is it down for everyone or just for me, and roughly how fast? A checker like IsDownAlarm fits here, and it's also how you get continuous monitoring without wiring anything into your site — the checker pings from its own infrastructure and pushes alerts by email, SMS, or Telegram when the site goes dark or slows to a crawl.
Synthetic monitoring schedules scripted checks from fixed locations around the globe — services like Pingdom, or detailed diagnostics from WebPageTest and Google PageSpeed Insights' lab runs. The point is controlled, comparable data: because the vantage point is fixed, any trend you see is a real change rather than a shift in your audience mix.
Real User Monitoring (RUM) collects timings from actual visitors' browsers, via a small JavaScript snippet or the field data PageSpeed Insights pulls from Chrome's public dataset. RUM shows what synthetic tests can't: the phone on hotel Wi-Fi, the tablet with thirty tabs open, the geography your marketing actually reaches.
| Method | Data Source | Primary Use Case | Pros | Cons |
|---|---|---|---|---|
| Simple status check (IsDownAlarm) | Single automated request from the checker's servers | "Down for everyone or just me?" plus baseline TTFB tracking | Instant answer; continuous checks with email, SMS, or Telegram alerts | Measures basic page fetch only; location-dependent result |
| Synthetic monitoring | Scheduled scripted checks from fixed global locations | Trend tracking, SLAs, controlled diagnostics | Consistent, repeatable, comparable over time | Not real users; may show behavior no visitor actually hits |
| Real User Monitoring (RUM) | Timings collected from real visitors' browsers | Understanding actual experience across devices and regions | Reflects the real world; catches issues synthetic misses | Requires traffic and a JS snippet; noisy on small samples |
Two measurement pitfalls matter more than tool choice. First: single readings are noise. A 900 ms reading on a site averaging 300 ms might be one congested moment. Use medians or high percentiles (p95) from repeated runs. Second: warm versus cold cache. A checker hitting a cached site sees your floor; a first-time visitor might see your ceiling. Know which one the number represents before you act on it.
Actionable Strategies for Reducing Server Response Time
Order matters here. Start with the highest-impact, lowest-risk fixes, and re-measure after each one.
1. Turn on caching. For nearly every CMS-driven slowdown, this is the fix. Page caching stores a rendered copy of the HTML so the server skips code and database work entirely — TTFB often drops by an order of magnitude. Object caching (Redis or Memcached) stores expensive query results for dynamic pieces. Browser caching headers let repeat visitors skip refetching altogether. If you do one thing from this article, do this.
2. Fix the database. Enable the slow query log and read it. Add indexes to columns you filter or join on — a missing index is the most common path to 900 ms queries. Collapse N+1 loops into joins. Prune absurdly heavy CMS plugins. This isn't exotic work; it's an afternoon with a query log and a console.
3. Deploy a CDN. A Content Delivery Network like Cloudflare caches your static assets (and optionally full pages) on servers near your visitors, collapsing those multiple HTTPS round trips into short hops. Check your cache-hit ratio after setup — a CDN with poor hit rates still forwards most traffic back to your origin and adds a middleman for the privilege.
4. Upgrade hosting when it's genuinely saturated. If CPU pegs at 100% during traffic spikes on shared hosting, no amount of caching discipline will save every request. Move to a VPS or dedicated instance. Before you pay, though, confirm saturation is real — many "slow server" complaints are configuration issues masquerading as capacity issues.
5. Place the server near the audience. If your customers are overwhelmingly European, host in a European region. Cloud providers like AWS expose explicit regions for exactly this reason. A CDN helps, but uncached dynamic requests still hit the origin — shorten that path.
6. Cut blocking work from the render path. Third-party API calls that block page assembly, synchronous payment-provider lookups on product pages, heavyweight template logic — move them off the critical path or cache their results. The page shouldn't wait on things the visitor can't see yet.
Protocol tune-ups. Enable keep-alive so one TCP+TLS setup serves many requests, and turn on TLS session resumption so returning visitors skip part of the handshake. HTTP/2 further reduces connection overhead. These squeeze the components from the request anatomy above rather than your application code.
Whatever you touch, apply the loop: take a baseline (say, p50 and p95 over a week), change one thing, re-measure. Changing three things at once and attributing the result wrongly is how optimization projects die.
Setting a Threshold That Actually Catches Problems
Absolute numbers are a rough guide; your own baseline is the real alarm system. Collect a week or two of readings, find your site's normal p50 and its p95, and set alert thresholds relative to that — a common workable setup is warning at roughly double your baseline and critical at triple or once you cross the 1-second absolute line. That catches degradation early without paging you every time a single check lands on bad timing.
Simple checkers like IsDownAlarm automating the recurring check, layered with a synthetic monitor for trends, gives you the tripwire and the context in one setup. The binary "is it up?" question stays answered; the interesting question — "is it getting slower, and at exactly which page?" — starts generating answers before your users start emailing you.
Frequently Asked Questions
Is server response time the same as page load speed?
No. Server response time — TTFB — is only the opening move: how quickly the server acknowledges a request and starts sending. Page load speed then covers downloading every asset and rendering the page in the browser. A quick TTFB is necessary for a fast page but never sufficient by itself.
Why is my site's response time different in different tools?
Because different tools occupy different vantage points and define the metric differently. A checker measuring from Virginia will get a faster answer from a Virginia-based server than a checker measuring from Singapore. On top of geography, one tool may count DNS time and another may not. Compare numbers within a single tool over time — cross-tool comparisons are apples and oranges.
Does response time affect my SEO ranking?
Yes. Google uses page speed as a ranking signal, and TTFB feeds directly into Core Web Vitals metrics like LCP. A chronically slow server response caps how well your pages can score on those assessments, which puts a drag on rankings — particularly painful when a competitor with similar content loads faster.
My response time is fast, but my website still feels slow. Why?
TTFB is only the beginning of the story. Oversized images, render-blocking JavaScript, sluggish third-party embeds like chat widgets, and heavy layout work all happen after the first byte arrives and can add seconds of perceived delay. Check the waterfall of full page load time; your bottleneck is somewhere downstream of the server.
How often should I check my website's response time?
For anything business-critical, continuous automated monitoring is the right answer — a service such as IsDownAlarm running checks around the clock and alerting you by email, SMS or Telegram when the site degrades or drops. For low-stakes projects, a weekly manual check plus a check after every significant deployment is a reasonable floor.
Can a CDN ever make my response time worse?
Rarely, but yes. If a CDN is misconfigured and requests keep missing its cache, each one takes a detour through the CDN only to fetch from your origin server anyway — one extra hop, a slightly worse TTFB. The fix is cache rules that actually match your content. Properly configured, a CDN shaves the setup round trips and shortens the path for nearly everyone.
Sources
- web.dev by Google — The definition of Time to First Byte (TTFB), its components, and Google's official benchmarks for what constitutes a 'good' TTFB.
- MDN Web Docs — Fundamental definitions of HTTP, status codes, and the mechanics of a client-server request-response cycle.
- Cloudflare Learning Center — In-depth explanations of DNS, CDN, caching, and latency, which are all primary factors influencing website response time.