Why Websites Go Down: DNS, Hosting, CDN, and Application Failures
Why "Is It Down for Everyone?" Is Only the First Question The first sign is usually a message from someone else. A customer emails that your store won't load. A colleague texts a s
Why "Is It Down for Everyone?" Is Only the First Question
The first sign is usually a message from someone else. A customer emails that your store won't load. A colleague texts a screenshot of an error page. You paste your URL into a status checker like IsDownAlarm and get the red verdict: down for everyone, not just you.
That answers exactly one question. The expensive question — the one that decides whether you're back in five minutes or five hours — is the next one: down why?
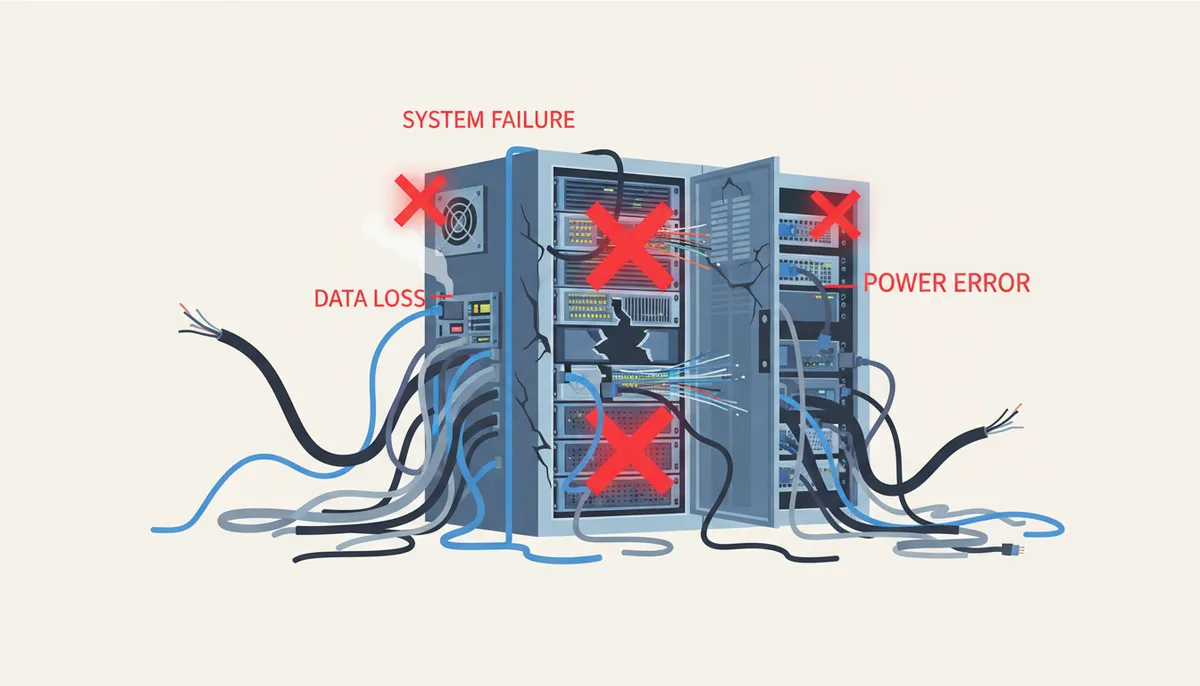
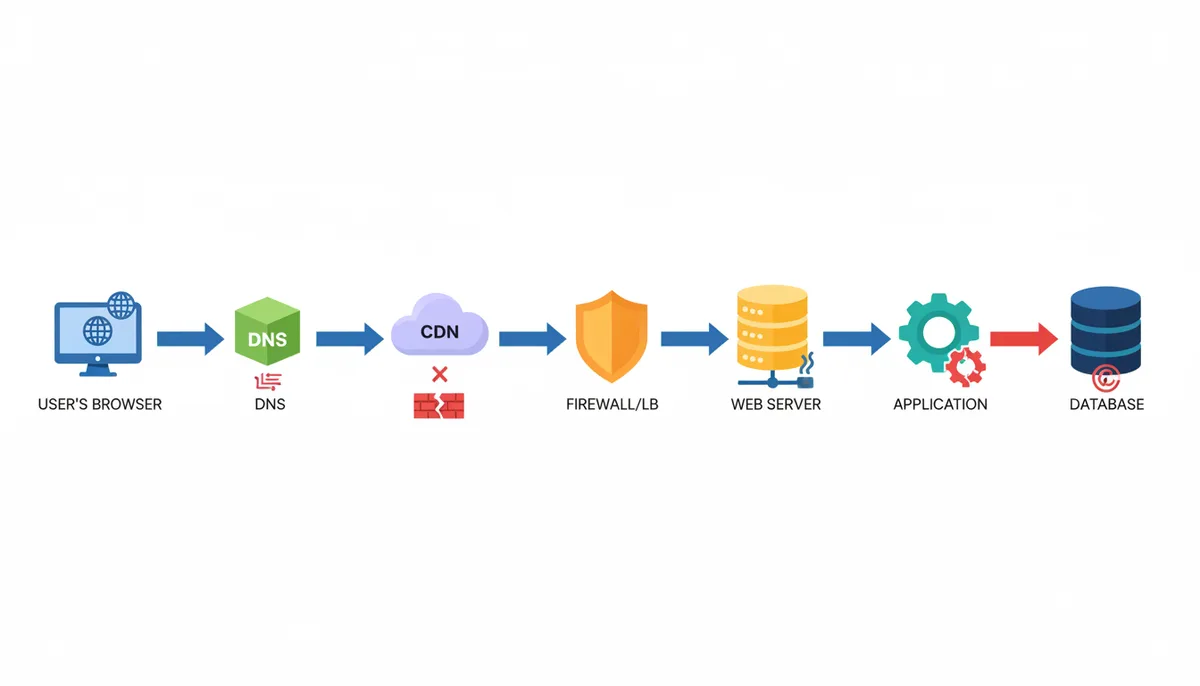
A "down" result is a symptom, like a fever. It tells you something is wrong and nothing about where. And here's the uncomfortable part: between a visitor's browser and your content sits a chain of mostly independent systems — DNS, your hosting server, maybe a CDN, a firewall or load balancer, your application code, your database. Each has its own owner, its own logs, and its own failure modes. Any single link can break on its own, and when it does, the entire site reads as "down" to the outside world, usually behind an error message that never names the real culprit.
This article walks that chain link by link: DNS failures, hosting and server problems, CDN outages, application errors, database trouble, third-party dependencies, attacks, and plain human mistakes. For each one, you'll get what it looks like from the outside, what actually breaks on the inside, and who can fix it. Then we'll turn that map into a diagnostic procedure and, finally, a prevention plan. The goal is a mental model you can reach for at 9 AM on a bad Tuesday — or 3 AM on a worse one.
The Anatomy of a Website Request: A Journey with Many Failure Points
Say a customer in Lisbon types yourshop.com and hits Enter. In the second or two before the page renders, their request passes through more independent systems than most people realize.
First, the browser asks the operating system's resolver for the IP address behind yourshop.com. The resolver — usually run by the ISP, or a public one like Google's 8.8.8.8 or Cloudflare's 1.1.1.1 — checks its cache. If nobody has asked recently, it works through the DNS hierarchy: root servers, then the .com servers, then your domain's authoritative nameserver, which finally answers with an A record — an IP address like 203.0.113.10. That answer gets cached for however long the record's TTL (Time to Live) allows, anywhere from 300 seconds to a full day.
Now the browser opens a connection to that IP. For most sites today, the IP belongs not to your server but to a CDN edge server sitting close to the user. The browser performs a TLS handshake — checking that the SSL/TLS certificate is valid and unexpired — and sends the request. If the edge server has the page cached, it answers immediately and your actual server never hears about it. If not, the request travels onward to your origin: through a load balancer if you have one, to a web server like Nginx or Apache, which hands it to your application runtime (PHP-FPM, Node, Python, Ruby). The application executes your code, queries the database — MySQL or PostgreSQL, typically — maybe calls a payment or shipping API, assembles the HTML, and sends it back up the chain.
Count the links: browser and local network, DNS resolution, CDN edge, origin network, load balancer or firewall, web server, application code, database. Seven-plus systems, and "website down" means at least one of them is broken. The saving grace is that each failure leaves a distinct fingerprint. A DNS failure produces "server IP address could not be found." A dead server produces a timeout. A crashed app produces a 500. A sick upstream produces a 502 or 504. Learning to read those fingerprints is half the job — we'll do it in the diagnosis section.
DNS Failures: When the Internet's Address Book Is Wrong
DNS exists because humans remember names and machines need numbers. When the lookup step breaks, your server can be humming along perfectly and still be completely unreachable — visitors simply can't find out where it lives. From their side, that looks identical to the server being on fire.
Wrong or stale records. The classic case: you migrate to a new host, update the A record, and typo one octet. Or you update it correctly but forget the old server's IP is still hanging around in a second record. CNAME records cause their own trouble — a CNAME pointing at a decommissioned cloud endpoint (an old Heroku or S3 hostname) resolves fine and serves nothing. And there's a genuine trap in the DNS spec: you cannot put a CNAME on a bare domain like example.com, only on subdomains. People discover this after breaking their root domain trying to point it at a CDN; the workaround is provider-specific features like ALIAS/ANAME records or CNAME flattening.
Propagation delays. A record change is instant at your authoritative nameserver, but every resolver on the planet may be holding the old answer until its cached copy expires. That's why, after a migration, your phone on cellular sees the new site while your laptop on office Wi-Fi still hits the old one. It's not "DNS being slow" — it's caches doing exactly what TTL told them to do. The professional move: drop the TTL to 300 seconds a day before a planned migration, make the change, verify, then raise it again. Full worldwide convergence is usually minutes to a few hours, but stragglers can take a day or more, which is why the standard advice says 24–48 hours.
Expired domain registration. When a domain lapses, the registrar typically stops answering for it or parks it on an ad page. Your site vanishes, replaced by NXDOMAIN errors or a page full of loan ads. Most registrars offer a grace period, then a redemption period with a painful fee, and then the name goes back on the market. This happens to real businesses every week, almost always because renewal notices went to an ex-employee's inbox or the card on file expired. Auto-renew plus a current card plus a current contact email is the entire fix.
Nameserver and provider outages. Your A record can be perfect, but if the servers that answer for your zone are down, nobody can resolve you. If both of your NS records point at one provider, that provider is a single point of failure for your entire online presence. The canonical example: in October 2016, a DDoS attack powered by the Mirai botnet hit Dyn, a major DNS provider, and for hours users across the US East Coast and parts of Europe couldn't reach Twitter, Netflix, Reddit, and dozens of other sites — whose servers were completely healthy. Since then, serious operators commonly run a secondary DNS provider.
DNSSEC misconfiguration. The sneaky one. If your DNSSEC signatures are wrong or expired, validating resolvers return SERVFAIL while non-validating resolvers work fine. Result: a maddening "down for some people, up for others" outage that survives every cache flush you try.
You'll recognize DNS-layer trouble by the browser error — Chrome shows DNS_PROBE_FINISHED_NXDOMAIN or "server IP address could not be found" — and by the dig command returning nothing, the wrong IP, or different answers from "dig @8.8.8.8" versus your default resolver.
Hosting and Server Issues: When the Site's Home Is Unreachable
Your web server software — Nginx or Apache, usually — listens on ports 80 and 443, answers requests, and hands the dynamic ones to your application. It runs on hardware: a slice of a shared machine, a VPS, a dedicated box, or a cloud instance. Failures here split into three families: the hardware dies, the software crashes, or the machine runs out of something.
Hardware failure — dead disks, failed power supplies, bad RAM — is the one people imagine first and encounter least. Cloud providers live-migrate or replace failing hosts; you'll rarely notice. On a dedicated server you own, a RAID controller or PSU dying at 2 AM is a real event, and you're waiting on the provider's remote hands.
Resource exhaustion is the actual number-one hosting-level killer, and it comes in four flavors:
- CPU. A traffic spike, a runaway cron job, or a bloated plugin pins the processor. Requests queue, response times climb from 200 milliseconds to 8 seconds, and then visitors start seeing timeouts. The server is "up" and useless.
- RAM. A memory leak grows for days until Linux's OOM killer steps in and shoots the fattest process — on a typical LAMP box, that's MySQL. Your "database outage" was really a memory shortage.
- Disk space. Log files and MySQL binlogs grow until the disk hits 100%. The database can't write, the site starts 500ing, and sometimes MySQL won't even restart until you free space.
- Inodes. Shared hosts cap the number of files, not just gigabytes. A cache or session directory that accumulates millions of tiny files trips the limit — the disk shows free space, yet no new file can be created, and sessions, uploads, and cache writes all fail at once.
Traffic spikes deserve special mention, because they surprise people. A small VPS serving uncached WordPress comfortably handles a handful of concurrent requests. A link from a popular site can send hundreds per second — the so-called hug of death. Shared hosts don't even wait for you to fall over; they throttle your CPU allocation and your site crawls before it dies. Proper page caching is the difference between a surge and an outage, which is why the same sudden popularity is a non-event for one site and a three-hour outage for another.
Where your site lives determines both how it fails and who gets paged:
| Hosting Type | Most Common Failure Point | Typical Cause | Who Fixes It |
|---|---|---|---|
| Shared | Resource throttling | Your site or a noisy neighbor exceeds CPU, memory, or inode caps | Provider for hardware and network; you for your site's resource usage |
| VPS | Out-of-memory crashes | Undersized instance, memory leak, no swap configured — you're the only admin | You, for everything above the hypervisor |
| Dedicated | Hardware failure | Dead disk, failed PSU, bad RAM | Provider replaces hardware; you handle OS and software |
| Cloud (AWS, GCP, Azure) | Architecture gaps | Single instance with no failover; instance or availability-zone failure | Shared responsibility: the provider fixes the platform; you architect around failures |
The shared-responsibility line matters in practice. On shared hosting and VPS plans, "the server is down" very often turns out to be "my site consumed its allowance." Before you open an angry ticket, check your control panel's CPU and memory graphs. And on cloud platforms, remember the deal is inverted: the provider almost never "goes down" for you specifically, but individual instances fail routinely, and surviving that is your design job, not theirs.
CDN Outages: When a Global Network Goes Dark
A Content Delivery Network puts copies of your site on edge servers around the world. Visitors connect to a nearby edge instead of your distant origin, TLS terminates there, attacks get scrubbed there, and your origin sees a fraction of the real traffic. Cloudflare, Fastly, and Akamai sit in front of enormous portions of the internet. That concentration cuts both ways.
When a major CDN stumbles, it takes a visible slice of the internet with it. In June 2021, a valid configuration change by one Fastly customer triggered a latent software bug, and for about an hour, government sites, major news outlets, and large retailers returned errors. Their origin servers were healthy the entire time — the layer in front of them was dead, and to a visitor, that distinction is invisible. Cloudflare had its own bad day in 2019 when a routine ruleset deployment pushed CPU usage to 100% across its edge network, returning 502 errors for sites that had changed nothing. The lesson isn't "avoid CDNs" — the performance and protection are worth it. The lesson is that putting a CDN in front moves your single point of failure to someone else's extremely reliable network. It is still a single point.
Regional failures are subtler. A CDN has dozens or hundreds of Points of Presence, and one of them can fail or get misrouted while the rest hum along. Your site tests fine from your office, fine from your monitoring service's default location, and is hard-down for everyone in Brazil. If you only ever check from one place, you will miss these entirely — multi-location checks exist precisely for this failure mode.
Then there are the self-inflicted CDN wounds. Misconfigured cache rules can serve stale pages for days after a deploy, or cache an error: your origin returns one 500, the edge faithfully caches it, and now everyone gets that 500 until the TTL expires or you purge. Worse, sloppy cache keys can serve one user's personalized page to another user — a security incident wearing a downtime costume. And the classic broken-layout complaint — new HTML referencing CSS and JavaScript the cache doesn't have yet — looks to users like the site was hacked.
One diagnostic trick worth memorizing: bypass the CDN. Point the domain directly at your origin IP with a hosts-file edit, or use "curl --resolve" with your origin's address. If the origin answers fine, the problem lives in the CDN layer — purge the cache and check your rules before you touch a line of application code.
Application and Code Errors: When the Website Breaks Itself
Everything so far has been infrastructure. Now imagine all of it healthy — DNS resolving, server idle, CDN purring — and the site still dead, because the code itself fell over. This is the home of the 500 Internal Server Error: the request reached your application, and your application crashed trying to answer it. WordPress users know its blunt cousin, the white screen of death.
Bad deploys are the single biggest cause. A missing environment variable, a config file still pointing at the staging database, file permissions reset during upload so the web server can't read its own code. It worked in staging because staging has the variable. In any incident, the first question out of your mouth should be: what shipped in the last hour? Correlation with a deploy is causation more often than anyone likes to admit.
Updates run a close second. A plugin or theme update that conflicts with another plugin. An auto-update that fires at 3 AM — a genuinely common way WordPress sites break while their owners sleep. A dependency bump with a subtle breaking change. Running a package update directly on production is Russian roulette; do it in staging or don't act surprised.
Interpreted-language fragility makes small errors total. One syntax error in a PHP file that every page loads means every page fatals — a single misplaced character in an .htaccess file produces an instant, site-wide 500. Compiled languages catch these at build time instead of in front of your users, which is one quiet reason teams put up with them.
Memory leaks in long-running processes are the slow poison. A Node or Java application's memory footprint climbs for days, the machine starts swapping, response times degrade, and then the process dies — your supervisor restarts it, and the clock starts over. A nightly restart masks the problem; a profiler actually fixes it. If your "unstable" app behaves beautifully right after every restart, this is your prime suspect.
Pool exhaustion sits at the boundary between application and capacity. PHP-FPM, the standard way Nginx talks to PHP, runs a fixed pool of worker processes — and some distribution defaults set pm.max_children as low as 5. The sixth concurrent request waits. Under real load, Nginx gets tired of waiting and returns 502 Bad Gateway or 504 Gateway Timeout. The code is fine; the configuration is the bug. It looks exactly like a dead server, and it lives in a one-line app config change.
Database Problems: When the Source of Truth Goes Silent
For a dynamic site, the database is the site. Content, user accounts, carts, orders, sessions — it all lives in MySQL or PostgreSQL. The application without its database has literally nothing to say. WordPress at least admits this with "Error establishing a database connection"; most frameworks just throw a 500 and let you guess.
Crashes usually trace back to memory. On a small VPS where the web server and database share RAM, MySQL is the OOM killer's favorite target — it's typically the biggest process on the box. The fix starts with evidence: search the system log for "Out of memory: Killed process" and confirm the why before you start tweaking settings.
Connection exhaustion is the most common database outage that isn't a crash. MySQL ships with a default max_connections of 151. Every PHP-FPM child or app worker wants at least one connection, and when queries slow down, workers hold connections longer while new requests pile up and demand more. The pool empties, new requests get "Too many connections," and the site is down while the database server reports itself perfectly healthy. The answer is connection pooling, saner worker counts, and faster queries — not blindly raising the limit until the server chokes for real.
Credentials and access break during changes. Someone rotates the database password and updates two of three config files. A migration moves the app to a new server, but the database user was granted as 'appuser'@'oldhost' and the new host doesn't match. Every page 500s, the logs scream access denied, and the fix is ninety seconds long once you read them.
Slow queries are outages in disguise. One unindexed query scanning millions of rows holds locks; other queries queue behind it; connections accumulate; load climbs; the site first crawls, then hangs, then serves 504s. A single ALTER TABLE on a large table during peak traffic does the same thing instantly — a classic junior-admin rite of passage. This is the most important pattern in this whole section: databases rarely die suddenly. They degrade first, and that degradation is your warning window.
Disk full deserves its own sentence because it's so common and so stupid: binlogs or slow-query logs fill the disk, MySQL halts mid-write, and occasionally corrupts a table on the way down. Check "df -h" early in every database incident. It will embarrass you less often than it saves you.
Third-Party Service Failures: The Risk of Your Dependencies
Modern websites are assemblies. A single page might depend on a payment gateway, a "Sign in with Google" button, a maps embed, reCAPTCHA, a font service, an analytics script, a chat widget, and a product-search API. Every one of those is someone else's uptime folded into yours.
The failure shapes vary. Payment API down: your site is technically "up" and your revenue is zero. Identity provider down: nobody can log in. Font service down with the wrong font-display setting: visitors stare at invisible text. reCAPTCHA down: every form on the site fails, including contact and checkout. Each of these is an outage by any honest definition, even though your server never noticed a thing.
The genuinely dangerous mechanism is the synchronous server-side call without a timeout. Your checkout code calls a tax or shipping API and waits for the answer. Default HTTP client timeouts often sit at 30 seconds or more. Ten concurrent checkouts mean ten of your workers parked, waiting on a corpse. Fifty requests later, your entire worker pool is blocked on one dead third party — and pages that never touch that API hang too, because there's no one left to serve them. One failed dependency has now taken down your whole site.
The frontend version is a render-blocking third-party script in the document head. If that provider's CDN stalls, the browser freezes first paint, and users see a blank white page and leave.
The rules are mechanical: every external call gets a short timeout — two to five seconds, not thirty — a defined fallback (skip the widget, queue the email, show a static apology), and ideally a circuit breaker that stops calling a service that's clearly dead. Then audit your dependencies with one question: if this returns nothing for fifteen minutes, what breaks? When the answer is "everything," rewire it.
Security Incidents: When Malicious Actors Take You Offline
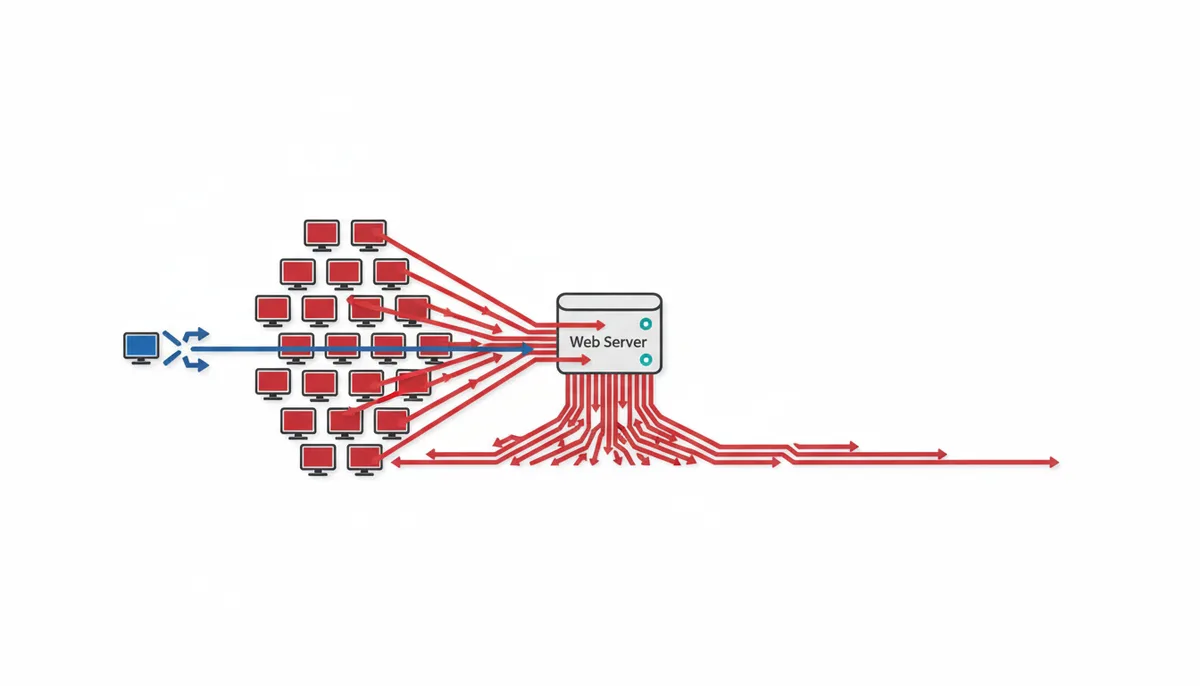
A Distributed Denial of Service attack is a crowding problem: an attacker floods you with more traffic than you can absorb so legitimate visitors can't get through. It comes in three flavors. Volumetric attacks saturate your bandwidth with sheer gigabits. Protocol attacks like SYN floods exhaust your server's connection tables. Application-layer attacks are the nasty ones for small sites — bots requesting your most expensive pages, like search results with random query strings, which are cheap to send and costly to serve. Motives range from extortion to a smokescreen for an intrusion to boredom, and small sites get hit too — often just for sitting in the wrong IP range, or because a botnet hammering your WordPress login page is itself a mini-DDoS.
Not every security outage is a flood. A successful intrusion can deface the site or delete files outright. A cryptominer won't take you down — it takes you slow, quietly eating your CPU for weeks. And there's one outage nobody expects: your own host suspending you. Providers scan for malware and phishing, and when they find it — often on a site that was compromised months earlier — they take the account offline first and email second. That email frequently lands in spam. If your site vanishes with zero warning and zero errors in your logs, check whether your host is trying to tell you something.
The twist is that your defenses can cause the outage themselves. A Web Application Firewall with an over-aggressive rule update starts flagging your legitimate API calls as SQL injection. Rate limiting blocks your biggest customer's entire office because fifty employees share one NAT'd IP address — or blocks your own monitoring service, so you're blind and broken. To the blocked user, a WAF rejection page is downtime. Review your WAF logs before you blame the host, the code, or the universe.
Sensible posture: put a CDN or WAF in front of the origin, rate-limit your most expensive endpoints, keep your host's abuse-desk contact somewhere you can find it, and decide in advance who has the authority to flip mitigations on during an attack.
Human Error and Configuration Issues: The Preventable Outages
Strip away the exotic causes and a large share of real-world downtime is one person making one small mistake. These are the embarrassing outages — and the cheapest ones to eliminate.
Expired SSL/TLS certificates. Let's Encrypt's 90-day certificates made encryption free — and made automation mandatory, because nobody reliably renews anything by hand four times a year. The failure mode is insidious: the auto-renewal quietly breaks (you moved DNS providers and the HTTP-01 challenge now fails; the cron job has been erroring for weeks; nobody reads cron mail), and one morning every visitor gets NET::ERR_CERT_DATE_INVALID behind a full-page browser warning most won't click past. Monitor the certificate's expiry date itself, not just whether the renewal script ran.
Expired domains we've covered — auto-renew, current card, current email. It still takes down real companies every week.
Configuration typos. One stray character in .htaccess is an instant site-wide 500. Nginx and Apache both ship with config testers — "nginx -t" and "apachectl configtest" — that validate before you reload. Use them every single time, even for "one-line changes." Especially for one-line changes.
Firewall fat-fingers produce a special kind of pain: a cloud security-group tidy-up that drops port 443, or "ufw enable" issued before "ufw allow ssh." Congratulations — the site is down and you've locked yourself out of the machine that fixes it. That one costs you a support ticket or a console session, plus your dignity.
Botched maintenance rounds out the list: a reboot that never comes back because of a typo'd fstab entry for the disk you added last month; a "quick manual fix" run against the production database that corrupts a table; a migration executed without a backup because it was "low risk."
The countermeasures are boring and nearly free: change one thing at a time, during a window you chose, with a written note of what you touched and a rollback you can execute in one step. When a mystery outage hits, the first place to search is your own last 48 hours.
How to Diagnose the Real Cause of an Outage
When the site drops, resist the urge to start restarting things. Random restarts destroy evidence and your memory of what you changed. Instead, walk the chain from the outside in, identify the failing layer, and only then touch anything.
- Confirm the scope. Run the URL through IsDownAlarm. "Down for everyone" means the problem is on your side. "Just you" means local trouble — your DNS cache, a stray hosts-file entry, a VPN, your office firewall. A quick second opinion: load the site on your phone over cellular, which uses a different resolver and a different network.
- Read the browser error like a clue. "DNS_PROBE_FINISHED_NXDOMAIN" or "server IP address could not be found" points at DNS. "Connection timed out" points at network, firewall, or a dead server. "Connection refused" means the host is alive but nothing is listening — web server down or port closed. A certificate warning is the TLS layer. 500 is your application. 502 or 504 is a proxy or CDN failing to get a sane answer from your server. 503 means alive but overloaded or in maintenance.
- Test DNS. Run "dig yoursite.com", then "dig @8.8.8.8 yoursite.com". No answer or NXDOMAIN: registrar or nameserver problem. Different answers: propagation or a stale resolver cache. The wrong IP: a bad record or the wrong nameservers set at the registrar.
- Test HTTP directly. "curl -I https://yoursite.com" shows you the real status code, which server answered (a Cloudflare header means you're talking to the edge), or a hang. Then bypass the CDN with "curl --resolve yoursite.com:443:ORIGIN_IP" — if the origin responds fine, the CDN or cache layer is your problem.
- Check the path if you need to. "traceroute" (or mtr) shows where packets die — inside your ISP, in transit, or at the host's doorstep. Most useful for "down for some regions" reports.
- Check status pages. Your host, your DNS provider, your CDN, your cloud region. If AWS us-east-1 is having a bad day, no amount of log-reading will fix your app.
- Go inside. Web server error log first, then application logs. "df -h" for a full disk, "free -m" for memory, and the system log for OOM-killer entries. For the database: can you connect from the app server, and how many connections are open?
- Build the timeline. Pull your monitoring history. Response time climbing for an hour before the flatline suggests resource exhaustion or slow queries; an instant cliff suggests DNS, an expired cert, a config change, or a deploy. Correlate with everything that changed — including other people's "quick fixes."
Keep this reference handy — it's the same procedure as a lookup table:
| Tool | What It Checks | What a Bad Result Looks Like |
|---|---|---|
| IsDownAlarm status check | Global availability from external vantage points | "Down for everyone" — the fault is on your side, not the visitor's; inconsistent results across locations indicate a regional or CDN issue |
| Browser error message | Which layer of the chain failed | NXDOMAIN = DNS problem; timeout = network or dead server; connection refused = port closed or server not listening; 500 = application error; 502/504 = upstream or proxy problem; certificate warning = TLS issue |
| ping | Basic host reachability | 100% packet loss suggests host unreachable, but many firewalls block ICMP so a failed ping alone does not prove an outage |
| traceroute / mtr | The network path between you and the server | The trace dies at a hop before your host's network — indicates a routing or ISP issue rather than your server |
| dig | DNS records and resolver behavior | NXDOMAIN, a missing A record, a wrong IP, or answers that differ between public resolvers (like 8.8.8.8) and your default resolver |
| curl -I | The actual HTTP response | A 5xx status code, a connection hang, a TLS handshake error, or headers that reveal you're talking to a proxy or edge rather than origin |
| Server error logs | What the server and application actually did | Stack traces, "Too many connections," OOM-killer entries, upstream timeouts, or permission errors that point to the real cause |
Two warnings on interpretation. A failed ping with a working curl means nothing is wrong — the host just ignores ICMP, as many do by policy. And the status pages in step 6 exist to save you hours: five minutes of checking them beats an afternoon of debugging a problem that lives in someone else's data center.
Building a Resilient Website: Strategies to Minimize Downtime
You will not reach 100% uptime. Nobody does. The realistic goals are rarer failures, shorter failures, and — most underrated — failures you learn about from your monitoring instead of from your customers.
Add redundancy where your chain is weakest. A secondary DNS provider (or at minimum one running an anycast network) removes the 2016-Dyn scenario. Two app servers behind a load balancer mean one can crash, deploy, or be patched while the other serves traffic. A database replica plus a documented failover — even a manual one — beats improvising at 3 AM. Multi-region architectures are the top of the ladder and multiply everything, including your costs and your opportunities for mistakes; earn your way there.
Know your number before you spend. Estimate what an hour of downtime costs you — lost sales, ad spend pointing at dead landing pages, support load, trust. A store turning over thousands per hour should buy redundancy a hobby blog shouldn't. Let that number size the budget instead of buying resilience by vibes.
Monitor from the outside, every minute, from more than one place. Internal metrics tell you how the server feels; external checks tell you what users get. An uptime monitor like IsDownAlarm checks your site at regular intervals and alerts you over email, SMS, or Telegram when it stops answering — typically within a minute of the failure, and often before the first customer notices. Turn on response-time alerting too: degradation is the warning shot that precedes most full outages, especially database and resource-exhaustion failures.
Backups that actually restore. Automated, stored off the server they protect, and restore-tested on a schedule — quarterly at minimum. An untested backup is a rumor. The day you need it is the wrong day to discover it's been silently failing since March.
Process is the cheapest layer. A staging environment for changes. Small deploys with a one-command rollback. A one-page runbook with logins, restart commands, provider account details, and the escalation order — written for the version of you that's awake at 3 AM and angry. Certificate and domain expiry dates monitored like uptime, because they're outages with a calendar invite you ignored.
The sites with the best uptime records aren't the ones that never break. They're the ones that notice in a minute and recover in ten. Both of those are disciplines, and both are entirely within reach of a one-person operation.
Frequently Asked Questions
What is considered a "good" uptime percentage?
The industry baseline is 99.9% — "three nines" — which still allows about 43 minutes of downtime per month. Don't be seduced by 99%: that sounds respectable and permits over seven hours of downtime a month, which no real business should accept. At the other end, "five nines" (99.999%) shrinks the budget to just over five minutes per year, and achieving it costs serious money in multi-region infrastructure and automation. For most small and mid-sized sites, aim for 99.9% plus fast detection and recovery — recovery speed usually matters more than chasing another nine.
Will my hosting provider compensate me for downtime?
Only if their Service Level Agreement says so, and usually in service credits, not cash — and usually only if you file a claim within a set window. Read the SLA's definition of "downtime" carefully: many providers count only network or hardware unavailability, not your site returning 500s. Scheduled maintenance is almost always excluded, and so is anything you caused yourself — your code, your configuration, or a traffic spike overwhelming an undersized plan. If uptime carries real revenue weight for you, the SLA is a purchasing criterion, not fine print.
Does website downtime affect my SEO rankings?
Brief, infrequent outages have little effect — Google's crawler simply comes back later. Frequent or prolonged downtime is different: repeated failed crawls mark your site as unreliable, rankings slide, and if an outage stretches long enough, pages can drop out of the index until they're re-crawled. One practical tip: when you take the site down deliberately for maintenance, serve a 503 status with a Retry-After header instead of letting it throw 500s. That status code tells crawlers "come back later" instead of "this site is broken."
What's the difference between a 500, 502, and 503 error?
A 500 Internal Server Error means the request reached your application and the application crashed — a bug, a fatal error, a missing dependency. A 502 Bad Gateway means a middleman — a CDN, load balancer, or reverse proxy like Nginx — asked your server for the page and got a broken or nonsensical answer, usually because the application process behind it died or its worker pool is exhausted. A 503 Service Unavailable means the server is alive but deliberately refusing: it's overloaded or in maintenance mode. You'll also meet 504 Gateway Timeout, which is 502's impatient sibling — the upstream server didn't answer at all within the time limit.
How can I get alerted the moment my site goes down?
With an external uptime monitoring service. These check your site from multiple locations around the world at regular intervals — every minute, on active plans — and notify you the moment checks start failing. IsDownAlarm does exactly this, with alerts delivered by email, SMS, or Telegram so the message reaches you wherever you are. The entire point is flipping who tells you: your monitor should inform you of an outage within a minute or two, instead of a customer informing you after forty.
My site is up, but it's extremely slow. Is that considered "downtime"?
Technically no — but operationally, it's an outage in progress. It's called performance degradation, and it springs from the same root causes as full downtime: CPU exhaustion, slow database queries holding locks, worker pools filling up, a struggling third-party API. Users treat a ten-second load as a dead site and leave, so the business damage is similar. More importantly, degradation is usually the warning phase: the pattern "site got slow, then site died" describes the majority of resource- and database-related outages. Treat severe slowdowns as incidents, and your full outages get rarer.
Sources
- Cloudflare Learning Center — Definitions and explanations for DNS, CDN, DDoS attacks, and SSL/TLS certificates.
- ICANN (Internet Corporation for Assigned Names and Numbers) — Authoritative information on the role of domain names, registrars, and the DNS root system.
- IETF (Internet Engineering Task Force) — Primary source for technical standards like RFC 9110 (HTTP Semantics) and RFC 2616 (HTTP/1.1), which define status codes like 500, 502, 503.
- Amazon Web Services Documentation — Best practices for building reliable and resilient cloud infrastructure, supporting the 'Building a Resilient Website' section.
- Google Cloud Documentation — Information on managing cloud hosting resources, load balancing, and diagnosing issues in a cloud environment.
- MDN Web Docs — Clear, developer-focused explanations of HTTP status codes, including the 5xx server error series.