How to Start Monitoring a Website for Downtime
Your store went down at 2:40 on a Saturday afternoon. Nothing flashed red, nobody called you, and you found out at 9:15 that evening when a customer replied to your own marketing e

Your store went down at 2:40 on a Saturday afternoon. Nothing flashed red, nobody called you, and you found out at 9:15 that evening when a customer replied to your own marketing email with "your checkout page is broken." Six and a half hours of dead air, and the only monitoring system you had was a stranger doing you a favor.
This is how most website owners learn about monitoring: the hard way. The fix takes about fifteen minutes and, for a small site, often costs nothing. This guide walks through the whole thing — how automated monitoring actually works, which metrics matter, how to pick a tool, the exact setup steps, how to configure alerts you'll actually trust, and what to do when one fires at 3 a.m. By the end you'll have a system that knows your site is down before your customers do, and tells you in a way you'll notice.
Why Manual 'Is It Down?' Checks Aren't Enough
Typing your URL into a one-off status checker — like the one on IsDownAlarm's homepage — answers exactly one question: right now, from this vantage point, does my site respond? That's genuinely useful when a customer says "your site's down" and you want to know if it's down for everyone or just them. But as a safety net, it has three fatal gaps.
It only works when you remember to check. Outages don't schedule themselves around your waking hours. If your site dies at 3 a.m. and you check it at 8 a.m. over coffee, that's five hours of downtime you slept through. The failure mode here isn't laziness — it's that manual checking depends on a human remembering to ask the question, and the question always feels unnecessary right up until it isn't.
The arithmetic gets ugly fast. Say your site brings in $1,500 on an average day. That's roughly $60 an hour spread evenly, but sales aren't spread evenly — they cluster in the hours when your customers are awake and buying. A three-hour outage during your peak window can easily cost $200 to $400 in direct revenue, and that's before you count the visitors who hit a dead page, assumed you're out of business, and bought from a competitor. You will never know how many people did that, because they don't email you. They just leave.
A single check from a single place can lie to you. Not every outage is total. Your site can resolve fine from your apartment in Chicago while visitors in Brazil get DNS errors because a stale record is cached at one resolver. Your CDN's Frankfurt edge node can throw errors while every other region loads perfectly. A manual check from your phone reports "up," and meanwhile a slice of your audience has been staring at an error for hours. You'll only hear about it if one of them is persistent enough to find your contact page — which, of course, they can't load.
So treat manual checks as a diagnostic tool, not a monitoring strategy. The moment your website matters to anyone besides you — customers, readers, clients, a boss — checking it by hand stops being a plan and starts being a liability.
How Does Automated Website Monitoring Work?
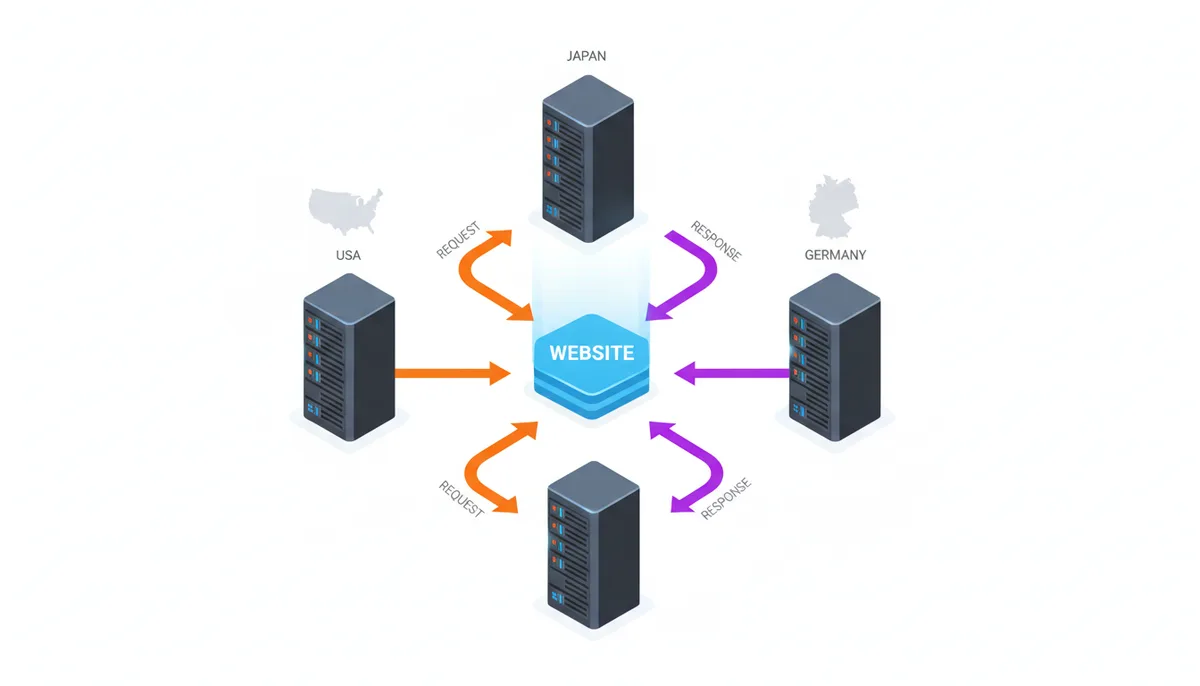
The core idea is almost disappointingly simple. A remote server — the monitor — sends a request to your website on a fixed schedule, exactly the way a visitor's browser would. It asks for a page, waits for the answer, and records two things: what came back and how long it took.
When your server answers with an HTTP 200 OK status code, the monitor logs "up" and goes back to sleep until the next check. When something goes wrong — the request times out because nothing answered within the limit (usually somewhere between 10 and 30 seconds), the DNS lookup fails, the connection gets refused, or the server replies with a 5xx error like 500 Internal Server Error or 503 Service Unavailable — the monitor logs a failure. Enough failures in a row and the monitor declares the site down, then fires an alert to whatever contact channels you've set up: email, SMS, Telegram, a webhook into your team chat.
Two configuration choices determine how good this safety net actually is.
Check interval is how often the monitor runs — every 30 seconds, 1 minute, 5 minutes. This sets your worst-case detection lag. With a 5-minute interval, an outage can burn for nearly five minutes before the next check even notices. Worse, an outage shorter than the interval can slip through entirely: if checks run at :00 and :05 and your site is dead from :01 to :04, both checks succeed and the outage never existed as far as your records are concerned. A 1-minute interval shrinks the blind spot to under a minute. That gap between 1-minute and 5-minute checks is the single most concrete difference between free and paid monitoring tiers.
Monitoring locations are the geographic points the checks run from. A single location can only tell you "the site is unreachable from here" — which might mean your server is down, or might mean a network link between that location and your host is having a bad day. That's why decent services confirm a failure by re-checking from a second location before they alert you. When servers in the US, Germany, and Japan all fail to reach your site within the same minute, it's you. When only one of them fails, the problem lives somewhere in the network between, and the alert looks very different.
This multi-location design exists because partial outages are real and common. In June 2021, a configuration change at the CDN provider Fastly triggered a bug that knocked major news sites, government pages, and large chunks of the internet offline for about an hour. Companies that size have entire infrastructure teams, and they still found out from their monitoring systems — because that's the only way anyone finds out fast.
What Are the Most Important Metrics to Monitor?
A monitor that only tells you "up" or "down" is useful. A monitor that tells you why and how fast is the one that saves you. Four metrics do most of the work.
Uptime is the binary one: did the server respond successfully or not? Over weeks and months, those individual checks aggregate into an uptime percentage, and this is where the "nines" come in. Over a 30-day month, 99% uptime means about 7 hours of downtime. 99.9% means roughly 43 minutes. 99.99% means about 4 minutes. This matters for two reasons: hosting providers and SLAs (Service Level Agreements — the contractual uptime promises your host makes to you) are written in these numbers, and a month's monitoring data tells you whether your host is actually delivering what you pay for. Don't chase 99.99% on a $5 shared hosting plan; do know your real number.
Response time is how long the server takes to answer each check, and it's your early-warning system. Sites rarely go from healthy to dead instantly — they degrade first. If your homepage normally answers in 300 milliseconds and the trend over a week climbs to 900, then 1,500, something is rotting: a database query getting slower as a table grows, a plugin update that added bloat, traffic outgrowing your hosting plan. Catching that curve lets you fix the problem on a Tuesday afternoon instead of during Saturday's outage. Set a response-time alert at roughly three to four times your normal baseline.
HTTP status codes are the specific reply your server sends, and they're the first diagnostic clue in any alert. A 200 OK means the page served correctly. A 404 Not Found means the server is alive but the page is gone — classic after a deploy that renamed something. A 500 Internal Server Error means your application crashed. A 503 Service Unavailable usually means overload or maintenance mode. The code narrows the search before you've opened a single log file.
SSL certificate monitoring is the one people forget until it burns them. HTTPS certificates expire — free Let's Encrypt certificates last 90 days, and even paid certificates are capped at about 13 months these days. Auto-renewal scripts fail silently all the time. When a certificate expires, browsers don't show your site with a small warning; they show a full-page "this site may be dangerous" interstitial that most visitors will not click past. Your server is up, your uptime monitor says everything is fine, and your site is effectively closed. Good monitors track days-until-expiry and warn you at 14 days and 7 days out.
Finally, there's the sneakiest failure mode: the 200 OK that isn't actually okay. Your server responds successfully, the uptime check passes — but the page is a white screen, a template error, or a "database connection failed" message. The fix is keyword monitoring (also called content checking): instead of just checking that the page loads, the monitor verifies that a specific piece of text is present. Pick a string that only exists when the page renders properly — your footer text, a product name — and the check fails when the page loads broken. You can also flip it and alert when the word "error" appears.
| Metric | What It Measures | Good State | Bad State (and What It Might Mean) |
|---|---|---|---|
| Uptime | Whether the server responds at all | HTTP 200 within the timeout window | Timeout or 5xx from multiple locations — server down, network failure, or crashed application |
| Response time | How long the server takes to answer | Steady, near your baseline (e.g., under ~800 ms) | Sudden spike or slow weekly climb — overloaded server, slowing database, growing traffic |
| HTTP status code | What the server says about the request | 200 OK, or an expected redirect to the right place | 404 (page missing after a deploy), 500 (application crash), 503 (overload or maintenance) |
| SSL certificate | Whether HTTPS still validates for visitors | Valid, trusted, with weeks left before expiry | Expired or expiring soon — browsers show a full-page security warning |
| Keyword / content | Whether the page actually renders correctly | Expected text present (footer, product name) | Text missing — 200 OK but a blank page or error message |
Choosing Your First Website Monitoring Tool
Before comparing feature lists, decide which category of tool you actually need, because there are two and they solve different problems.
Uptime monitors answer one question well: is my site reachable, and if not, tell me immediately. UptimeRobot has been the default starting point for years with a free tier that covers basic checks; Pingdom is one of the original names in synthetic monitoring; IsDownAlarm combines one-off status checks with continuous monitoring and alerts over email, SMS, and Telegram. These tools are cheap or free, take minutes to set up, and need nothing installed on your server.
Application Performance Monitoring (APM) suites — Datadog and New Relic are the well-known examples — answer a different question: why is my site slow or broken? They instrument your code, trace database queries, and profile what's happening inside the application. They're powerful, expensive, and genuinely complicated to set up. You do not need one to start monitoring for downtime, and buying one on day one is a good way to spend a weekend configuring dashboards instead of solving your actual problem. Start with an uptime monitor. Graduate to APM when you have a performance problem you can't diagnose from the outside.
Within the uptime-monitor category, here's the checklist of features that actually matter for a first setup:
- Multiple monitoring locations with confirmation checks — a failure should be verified from a second location before you get paged, or you'll drown in false alarms.
- A configurable check interval down to 1 minute — 5 minutes is acceptable on a free plan, but you want the option to tighten it.
- At least two alert channels — email plus something that can wake you up, like SMS or Telegram.
- Recovery notifications — an alert when the site comes back up, so you know the incident is over and how long it lasted.
- SSL certificate expiry alerts — the failure mode your uptime checks won't catch on their own.
- A readable uptime history — you'll want monthly uptime percentages for SLA disputes with your host and for your own trend-watching.
Pricing across the market follows a fairly predictable shape. The numbers below are typical ranges across well-known services, not quotes from any single vendor — check current pricing before you commit.
| Tier | Typical Price | Monitors Included | Minimum Check Interval | Alert Channels | What You Get Beyond Uptime |
|---|---|---|---|---|---|
| Free | $0 | 1–5 (some allow more) | 5 minutes | Basic uptime history | |
| Basic paid | ~$7–15 / month | 10–50 | 1 minute | Email, SMS (capped), Slack, Telegram, webhooks | SSL monitoring, keyword checks, public status pages |
| Pro / business | ~$25–60+ / month | 50–200+ | 30 seconds | SMS, voice calls, escalation rules, team integrations | Transaction monitoring, API checks, multi-user access |
My advice: start on a free tier today, because the best monitoring setup is the one that exists. Upgrade to a paid tier the first time one of two things happens — you take money through the site (which justifies the 1-minute interval), or a free-tier limitation causes you to miss or misread a real incident.
Step-by-Step: Setting Up Your First Uptime Monitor
The exact buttons differ between tools, but the process is essentially identical everywhere. Here's the universal walkthrough, including the decisions that trip people up.
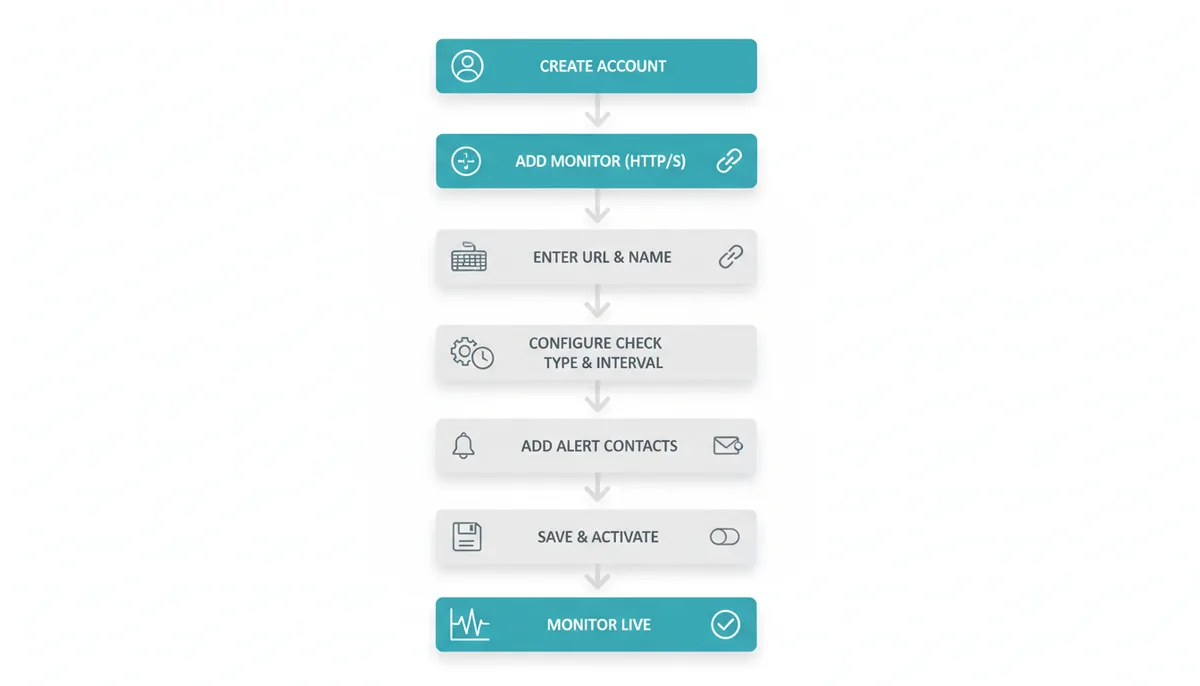
- Create an account. Email and password, verify the address. On IsDownAlarm, for example, this is the Sign Up flow — a minute of work before you add your first monitor.
- Add a new monitor and pick the type. For a website, you want an HTTP/HTTPS monitor — it requests the page like a browser would. Other types exist for other jobs: ping (ICMP) checks whether a server machine responds at all, port monitors check whether a specific service like a mail server is listening, and keyword monitors add the content check described earlier. HTTPS is the right default.
- Enter the URL carefully. Use your final, canonical address — the
https://version of the domain your visitors actually land on, not a URL that redirects there. A monitor pointed at an old URL may happily follow a 301 redirect and report "up" while the real destination is broken. One more refinement: your homepage is often served from a CDN cache and can stay green while everything dynamic is on fire. If your site has a page that exercises the full stack — a pricing page or search page that hits the database — monitor that too. Two monitors catch what one misses. - Set the check interval. Take 1 minute if the site generates revenue and your plan allows it; 5 minutes is a perfectly reasonable starting point otherwise. Going below 1 minute buys you little unless you run something genuinely time-critical.
- Choose monitoring locations. If the tool lets you select them, pick at least three spread across continents — say, North America, Europe, and Asia-Pacific. Leave the "confirm from a second location before alerting" option switched on.
- Add alert contacts. This is where setups quietly fail. Add your email, obviously — but email alerts die in spam folders and promotions tabs all the time, and nobody reads email at 3 a.m. Add a channel that can actually interrupt you: SMS to your phone, or a Telegram message if you live in that app. If the service offers a test-alert button, press it and confirm the message actually arrives where you expect.
- Save, activate, and verify. The monitor should show its first successful check within one interval. Then do the thing almost nobody does: test the failure path. Temporarily point the monitor at a URL that doesn't exist (a nonsense subdomain works) and watch the full cycle — failed checks, confirmation, down alert arriving on your phone, then the recovery alert when you point it back. Ten minutes of testing tells you the entire chain works, including the parts you configured blind.
Configuring Alerts That Don't Cause Fatigue
Here's the failure mode nobody warns you about. A flaky plugin makes your site hiccup for ninety seconds every night around 2 a.m. Your monitor, doing its job perfectly, texts you every time. By week three you've gotten fourteen middle-of-the-night alerts for incidents that fixed themselves, and you've muted the notification channel. In week five, a real 40-minute outage happens. You see the alert at breakfast.
Alert fatigue is how monitoring systems die. Every false or trivial alert teaches you to ignore the next one, so configuring alerts is really about protecting your own trust in them. Four rules keep the signal clean.
Require confirmation. Keep the multi-location verification on, and set alerts to fire only after two or three consecutive failed checks rather than the first one. A single failed check is usually a 20-second network blip somewhere on the internet, not your site. The trade-off is real — you add a minute or two to detection time — but an alert that's right 98% of the time gets read, and an alert that's right 60% of the time gets muted. Take the delay.
Split alerts by severity. Not every event deserves to wake a human. Route response-time warnings and SSL expiry reminders to email, where they'll wait politely for morning. Reserve SMS and push-style channels for confirmed downtime. The rule of thumb: if reading the alert can wait eight hours without consequences, it should never make a sound.
Keep recovery alerts on. The "your site is back up" message isn't noise — it's what closes the incident, tells you the duration for your records, and lets you go back to sleep without getting up to check.
Use maintenance windows. If you're deploying an update or migrating hosts on Sunday at 2 a.m., pause the monitor for that window. Alerts during planned work train you that alerts are sometimes ignorable, which is exactly the habit you're trying not to build.
Then set up an escalation policy — a chain defining who gets told, when, and how loudly. A sensible starter chain for a solo operator: email the moment downtime is confirmed; SMS if the site is still down after 10 minutes; and if it's still down at 30 minutes, escalate to a second person or a voice call. If the person who can actually fix the problem is your hosting provider's support line, their contact details belong in that chain too. Finally, review your alert history every few months. Any alert you've ignored three times in a row is misconfigured — tune the threshold or turn it off, because it's currently training you to ignore the real one.
How to Interpret Alerts and Diagnose an Outage
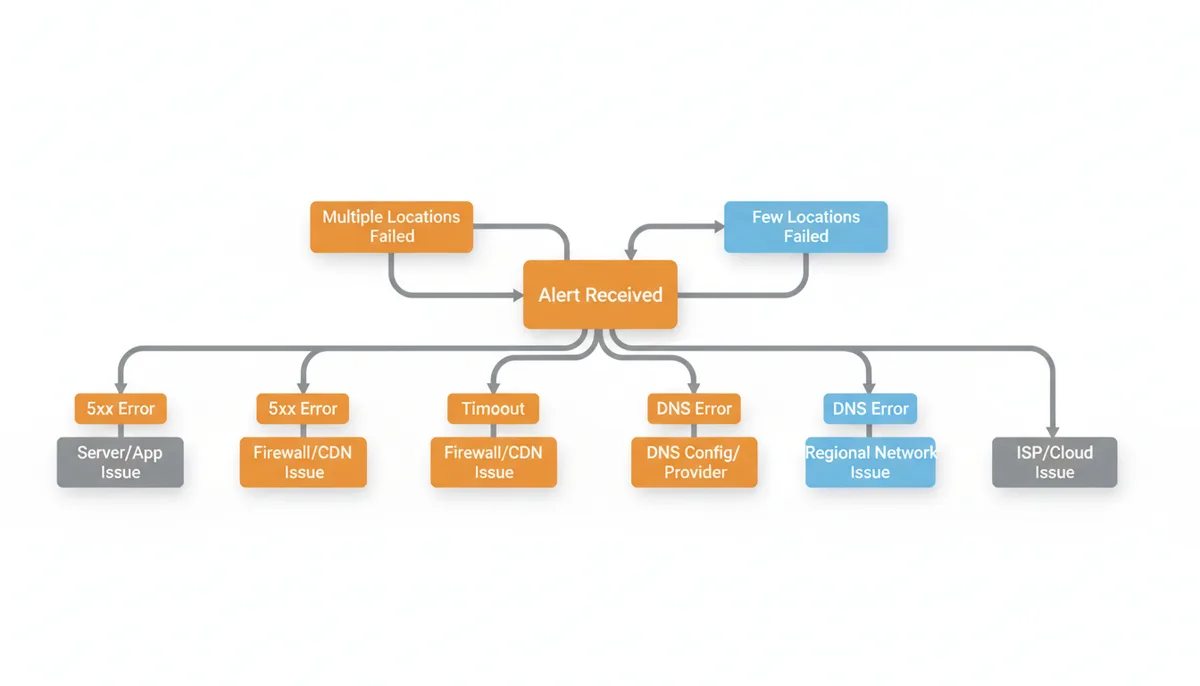
An alert lands: "DOWN — Connection Timeout — detected from 6 of 6 locations at 14:02 UTC." Three pieces of information in that message do most of the diagnostic work: the timestamp (mind the timezone — convert it before correlating with anything else), the error type, and how many locations saw it.
Start with the locations. If every location failed, the problem is almost certainly on your side — your server, your application, your DNS. If only one or two locations failed while others succeeded, your site is probably fine and the problem sits in the network between those locations and you: a regional CDN issue, a peering problem, a resolver serving stale DNS. That distinction alone cuts the search space in half.
Then let the error type point you at the layer that's broken:
- DNS error / name not resolved — the domain itself can't be looked up. Check whether your domain registration expired, whether you changed nameservers recently, and whether your DNS provider is having an incident.
- Connection timeout — nothing answered at all. The server is down, the network to it is broken, a firewall is dropping traffic, or the machine is so overloaded it can't respond. If it's from one location only, suspect the network path, not your server.
- Connection refused — the machine is reachable but nothing is listening on the web port. Classic signature of a crashed web server (nginx or Apache stopped) on an otherwise healthy box.
- 500 Internal Server Error — your application code crashed. Check the application logs around the alert timestamp; the usual suspects are a bad deploy or exhausted database connections.
- 502 Bad Gateway / 504 Gateway Timeout — the front-end proxy (nginx, a load balancer) is alive but the application behind it (PHP-FPM, Node, your app server) is dead or too slow to answer.
- 503 Service Unavailable — the server is deliberately refusing: maintenance mode, rate limiting, or overload protection kicking in. On some platforms it's the generic "over capacity" response.
- 404 Not Found — the server is healthy; the specific page is gone. Someone renamed or removed it in a deploy. Either restore the page or update the monitor URL.
- SSL error — the certificate expired or was misconfigured during a renewal. Renew it and check that your auto-renewal actually ran.
Worked example: your alert says 503 from all six locations at 14:02. You deployed an update at 13:58. You don't need a monitoring tool to solve this one — roll back first and investigate second. The value of monitoring in that story isn't the diagnosis; it's that you found out in four minutes instead of from a customer at 3:30 p.m.
For anything less obvious, correlate three sources: your hosting provider's status page (is it them?), your own server and application logs at the alert timestamp (is it you?), and your deploy history (did something just change?). Afterward, write a five-line root cause analysis: what broke, when detection happened, what fixed it, and what would prevent a repeat. That habit, more than any tool, is what separates sites that keep having the same outage from sites that don't.
Beyond Uptime: Advanced Monitoring You'll Eventually Need
Uptime monitoring watches your front door. Eventually you'll want cameras inside the building too. Three upgrades are worth knowing about now so you recognize the moment you need them.
Synthetic transaction monitoring simulates a multi-step user journey instead of a single page load: open the login page, submit test credentials, verify the dashboard loads. Or add a product to the cart and confirm the cart page shows it. This catches the failures a homepage check can't — the site is up, the login is broken; the site is up, checkout throws an error. Because these checks are heavier, they run less often, typically every 15 to 30 minutes. The moment your business depends on a flow rather than a page, this becomes the monitor that matters most.
Real User Monitoring (RUM) works from the other direction entirely. A small JavaScript snippet on your pages collects timing data from actual visitors' browsers, showing you what real people experience across devices, networks, and countries. Synthetic monitoring is a controlled lab test — same check, same conditions, every time. RUM is the field report — messy, real, and the only way to learn that your site is painfully slow for mobile users in a specific region. Start with synthetic (it works even with zero traffic) and add RUM once you have enough visitors for the data to mean something.
API monitoring applies the same request-and-verify logic to the APIs you run or depend on — checking not just the status code but that the response payload has the expected shape, and how long it took. If your site relies on third-party APIs (payments, maps, shipping rates), monitor those too. When something breaks, you'll know in one glance whether the fault is yours or theirs, which changes who you call.
The last piece is a public status page: a simple page showing the current status of your services, updated automatically by your monitoring data, where you can post incident notes during an outage. During an incident it absorbs the flood of "is it down?" messages and support tickets, and the transparency generally earns you goodwill rather than costing it. One practical rule: host the status page on infrastructure separate from your main site, because a status page that's down during your outage is worse than none at all.
None of this is day-one work. Day one is an uptime monitor with an interval, three locations, and an alert channel that can wake you up. Add the layers when downtime starts costing you something specific — that's the signal you're ready for the next one.
Frequently Asked Questions
Will monitoring my website slow it down?
No. A standard uptime check is a single lightweight HTTP request every few minutes — indistinguishable from one normal visitor loading one page. Against even modest traffic that's a rounding error, and your server won't notice it. The only checks with any real weight are heavy synthetic transaction scripts, and those run infrequently by design. If monitoring is measurably affecting your site's performance, the site had far bigger problems already.
How often should I check my website for downtime?
A 1-minute interval is the standard for any site that generates revenue — it caps your worst-case blind spot at under a minute. Free plans commonly offer 5-minute intervals, and that's a reasonable starting point for personal sites, blogs, and side projects where a few minutes of unnoticed downtime costs nothing. Genuinely time-critical services sometimes check every 30 seconds, but below that you're paying for detection speed you're unlikely to act on.
What's the difference between uptime monitoring and performance monitoring?
Uptime monitoring answers a binary question from the outside: is the site up or down, and how fast does it respond to a simple request? Performance monitoring — APM tools like Datadog or New Relic — works from the inside, tracing code execution, database queries, and external calls to explain why the site is slow or erroring. Uptime monitoring tells you that you have a problem; APM helps you find where in the machinery it lives. Start with the first; add the second when "it's slow" stops being a good enough diagnosis.
Can I monitor a website that requires a login?
Yes, but a plain uptime check can't do it — it will only ever see the login page. You need a tool that supports transaction monitoring, where you script the steps a user would take: load the login form, submit credentials, then verify a keyword on the page behind the login. That scripted check runs on a schedule and alerts you when any step fails. Use a dedicated test account for this rather than real credentials.
How much does website monitoring cost?
Anywhere from nothing to serious money, depending on what you need. Free tiers from several established services are genuinely sufficient for personal sites — a handful of monitors at 5-minute intervals with email alerts. Paid plans for small businesses typically start around $10 to $50 per month, with the price climbing based on how many sites you monitor, how frequently, and whether you need extras like SMS credits, transaction checks, or team access. The honest answer for most people: start free, and let a real incident — or the revenue your site generates — tell you when to pay.
Can I set up a public status page for my users?
Yes, and many monitoring services include status pages as a built-in feature on paid tiers. The page displays the current operational status of your services automatically, fed by your monitoring data, and gives you a place to post updates while an incident is ongoing. It's one of the cheapest trust-building moves available to you during an outage — users forgive downtime far more readily than they forgive silence. Just make sure it's hosted separately from the site it's reporting on.
Sources
- MDN Web Docs by Mozilla — Definitions and explanations of HTTP status codes (2xx, 4xx, 5xx), which are fundamental to interpreting monitoring results.
- Google SRE — The foundational concepts of service reliability, including Service Level Objectives (SLOs) and the philosophy behind proactive monitoring, which informs the 'why' of the article.
- Cloudflare Learning Center — Authoritative explanations of core internet infrastructure like DNS, CDNs, and SSL, which are often the root causes of downtime discussed in the diagnosis section.
- W3C (World Wide Web Consortium) — The official standards for web protocols like HTTP, providing the ultimate authority on how web requests and responses are supposed to function.
Related reading
- How to Cut False Downtime Alerts Without Missing Real OutagesRead →
- How to Choose Between Email, SMS, and Telegram Downtime AlertsRead →
- How to Read Uptime and Response Time TogetherRead →
- How Often Should You Check a Website for Downtime?Read →
- How to Tell if a Website Is Down for Everyone or Just YouRead →